State of the Global Family
Background and SDG Connections
Want to know more about the topics highlighted on the Quick Trip to 8 Billion poster? Start your exploration below. In addition to current information about all of the infographics, you’ll find out how these issues are addressed by the UN Sustainable Development Goals (SDGs). The SDGs were set in 2015 for where the global community could be in 2030 if the efforts are made and sufficient resources are allocated to improve conditions for people and the planet.
Jump to any of the four topical categories:
People & Society | Environment | Food & Agriculture | Health
People & Society
Global Population Projections
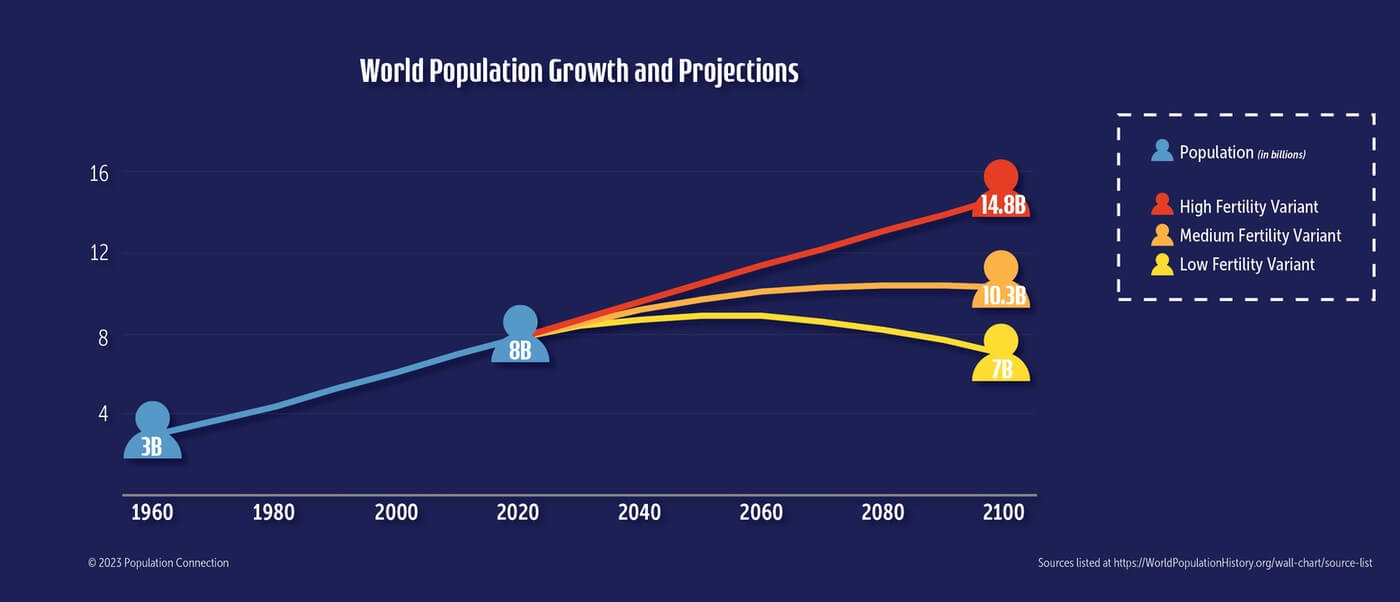
There are several variables that demographers consider when trying to make population projections. The primary variable is the fertility rate, defined as the number of children a woman will bear during her reproductive years (age 15-44). Demographers at the United Nations developed a series of these projections for their report, World Population Prospects: 2022 Revision, based on possible changes to the global fertility rate through this century in all parts of the world. They provide three population estimates based on different scenarios unfolding. The Medium Variant projection expects global population growth to continue until the 2080s before it levels off at over 10 billion people. A full explanation of these latest projections can be found here.
An Urban World
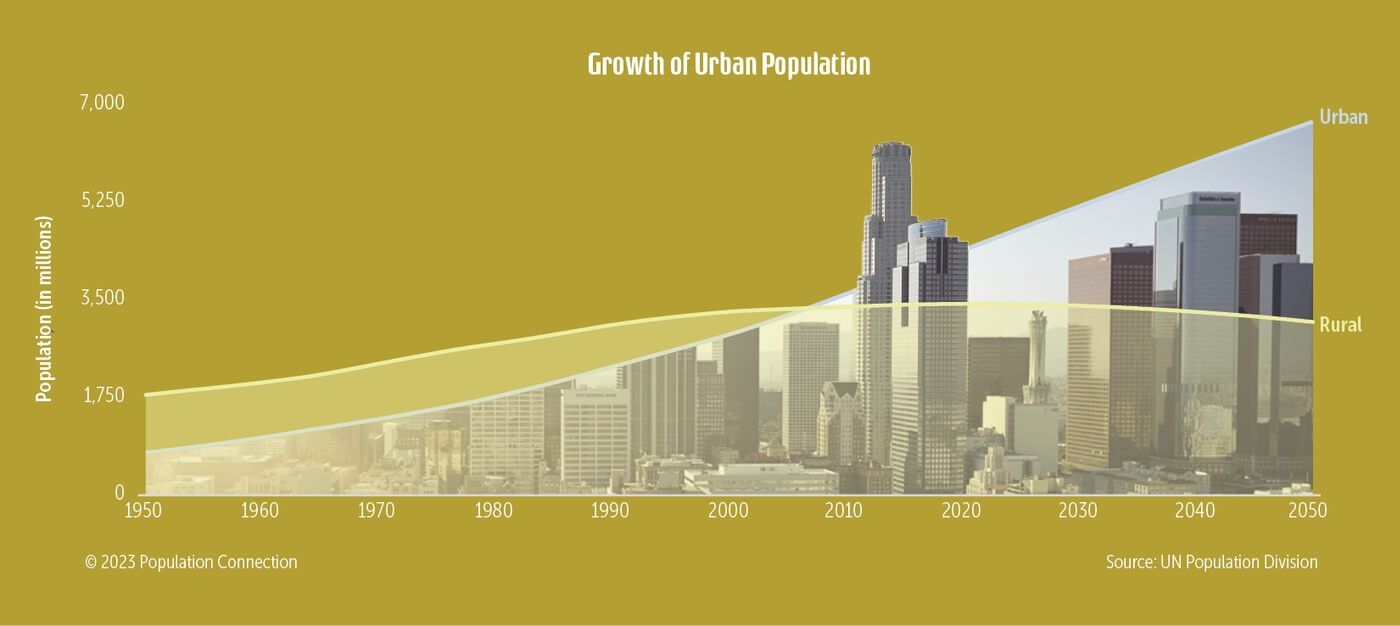
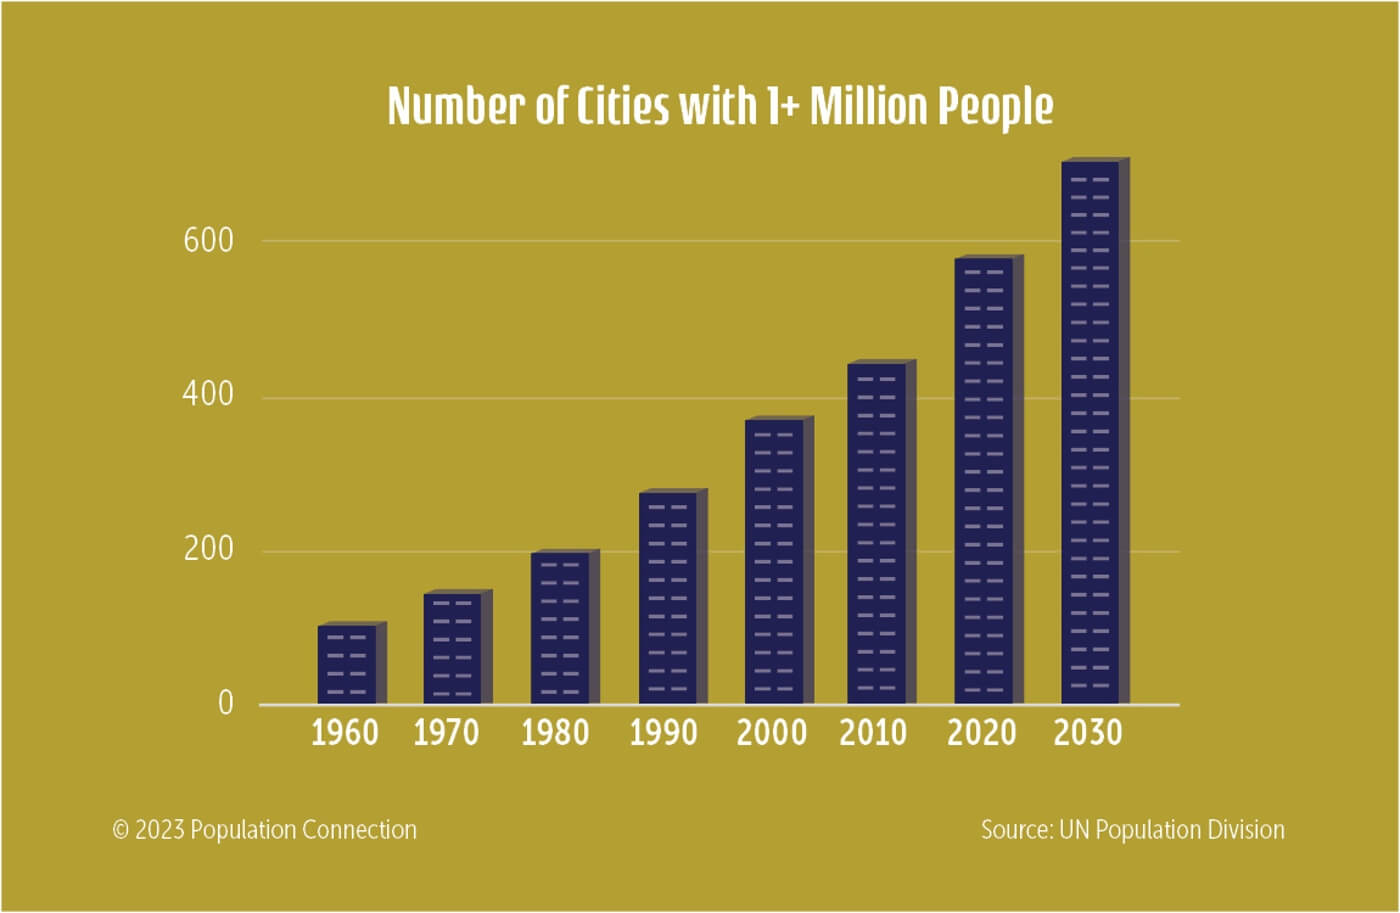
The rise of urban living is a relatively recent phenomenon. In 1800, just 3 percent of the population lived in cities. Today, well over half of the global population lives in urban areas. The number of very large cities is also on the rise, with 33 “megacities” (those with over 10 million residents) in 2018, most in Asia and Africa.
Cities can be vibrant cultural and economic hubs, but also need to be sustainable so that residents’ needs are adequately met for housing, transportation, energy, employment, education, and a healthy environment. Find out more about global urbanization trends and challenges here.
SDG 11 (Sustainable Cities and Communities) seeks to make cities and human settlements “inclusive, safe, resilient and sustainable.” This includes safe and affordable housing and basic services, accessible and sustainable transportation systems, adequate green spaces and other measures to ensure public and environmental health.
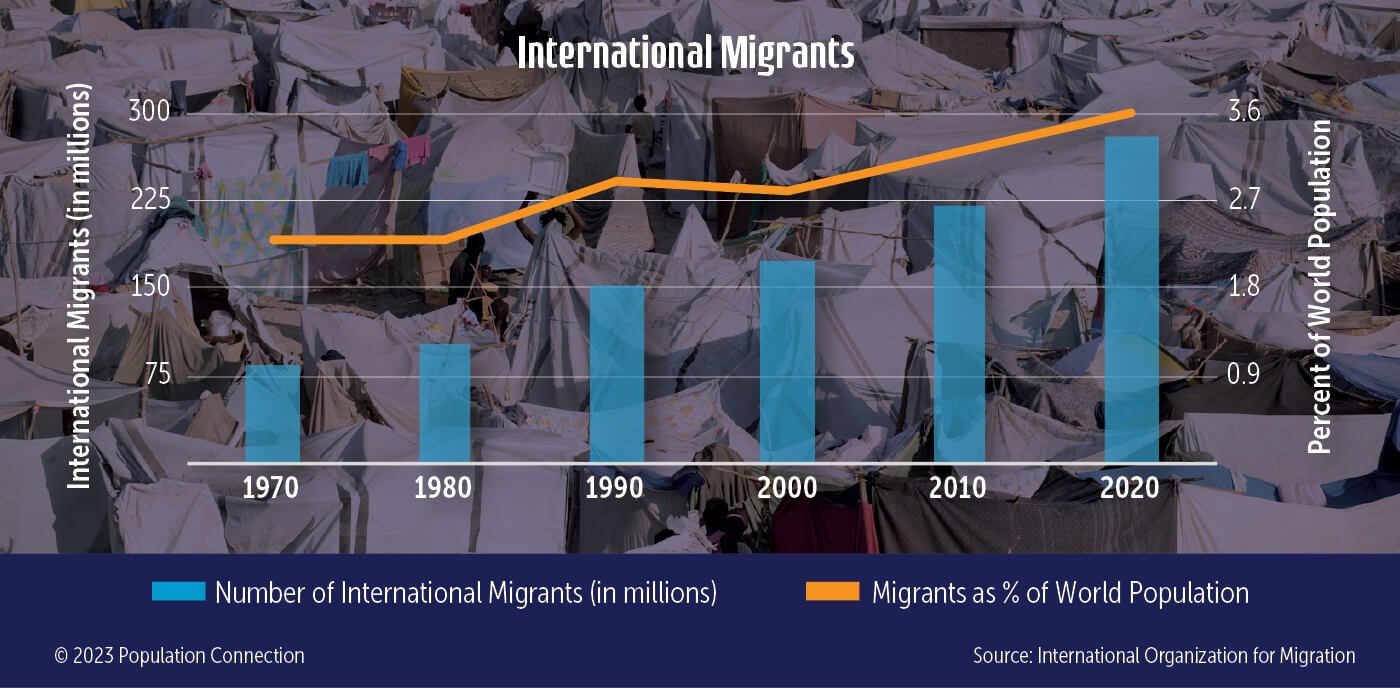
People on the Move: Global Migration
While migration has been part of the human existence for millennia, the number of international migrants is on the rise. In 2020, 281 million people (3.6 percent of the world’s population) lived outside their country of origin, up from 175 million people in 2000 – a 60 percent increase. About 70 percent of international migrants move to neighboring countries.
Migration is fueled by various “push-pull” factors. For instance, civil strife and warfare push people from their homes, often toward refugee camps or asylum in other countries. The changing global climate is creating a population of environmental refugees, being pushed from their homes due to rising sea levels or droughts. The pull of economic opportunities leads immigrants across national borders to seek a better life. For many migrants, leaving their home countries is by necessity, not choice. In 2022 there were 32.5 million refugees worldwide, among 103 million forcibly displaced persons. Dangerous conditions often await migrants on their journeys over land and sea. In 2022, alone, nearly 7,000 lives were lost along migratory routes.
Migrations of people from one country to another can bring benefits to the destination country, such as cultural diversity or a renewed labor force. It can also present challenges, such as needing to provide the social services and infrastructure for new residents requiring jobs, homes, schools and health care. In 2020 the largest countries of origin were India, Mexico and the Russian Federation. The largest destination countries were the United States and Germany.
SDG 10 (Reduced Inequalities) calls for facilitating orderly, safe, regular and responsible migration and mobility of people, including through the implementation of planned and well-managed migration policies (10.7).
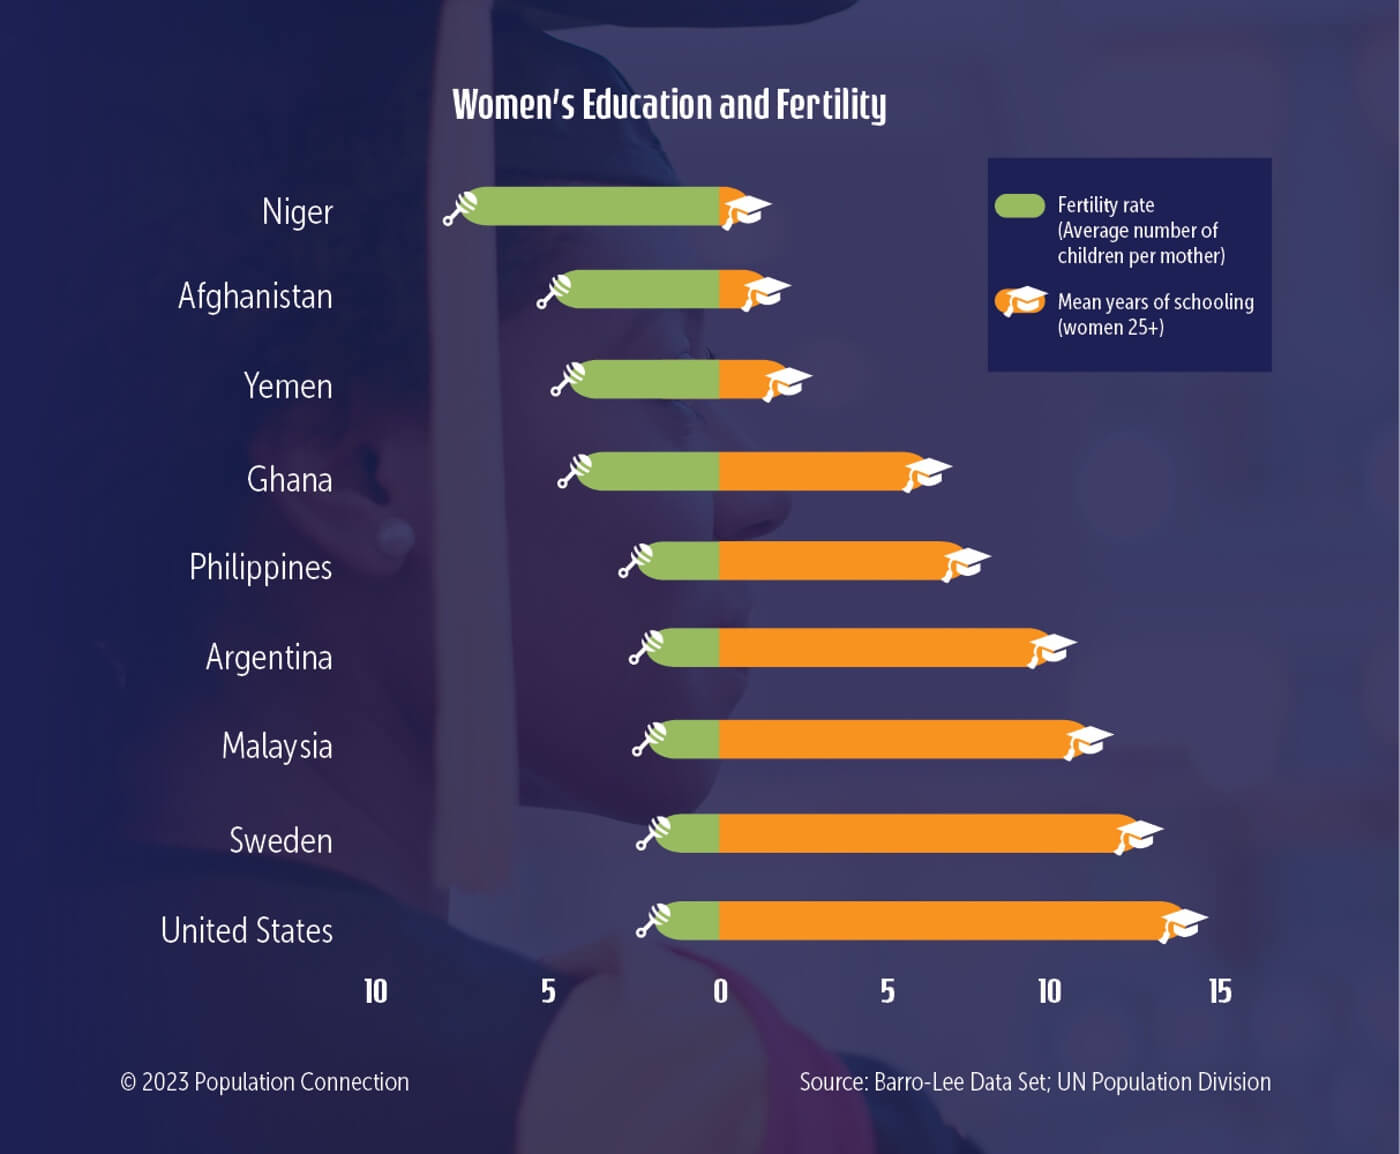
How Are Female Education and Falling Fertility Rates Related?
Educational attainment among girls and young women can impact eventual family size. Because education increases women’s self-sufficiency, it also decreases their dependency on having many children for security and status. The amount of schooling is one of the best predictors of how many children a woman will have and how healthy those children will be. Studies repeatedly show that educated women marry later, want fewer children, are more likely to use effective methods of family planning, and have greater means to improve their economic situation.
Gender parity in education has been improving around the world, but inequities still persist in many places. Cultural norms can force girls to leave school to take on responsibilities at home, such as cooking, cleaning, gathering fuelwood, and caring for younger children. While school enrollment for boys and girls is about equal in the elementary grades, they start to diverge in secondary school, especially in the Arab States and sub-Saharan Africa. According to UNESCO, 67 million adolescent girls are not in school today. In sub-Saharan Africa, where illiteracy among adult women is nearly 40 percent, the average number of births per woman is 4.6. In Latin America and the Caribbean, where illiteracy rates for women have fallen to around 6 percent, the average number of births per woman is 1.9.
SDG 4 (Quality Education) seeks to ensure that all girls and boys can “complete free, equitable and quality primary and secondary education leading to relevant and effective learning outcomes” (4.1). There are also targets for equal access to post-secondary education (4.3) and to eliminate gender disparities at all levels of education (4.5).
SDG 5 (Gender Equality) seeks to end all forms to discrimination against all women and girls everywhere (5.1) and to prevent child marriage.
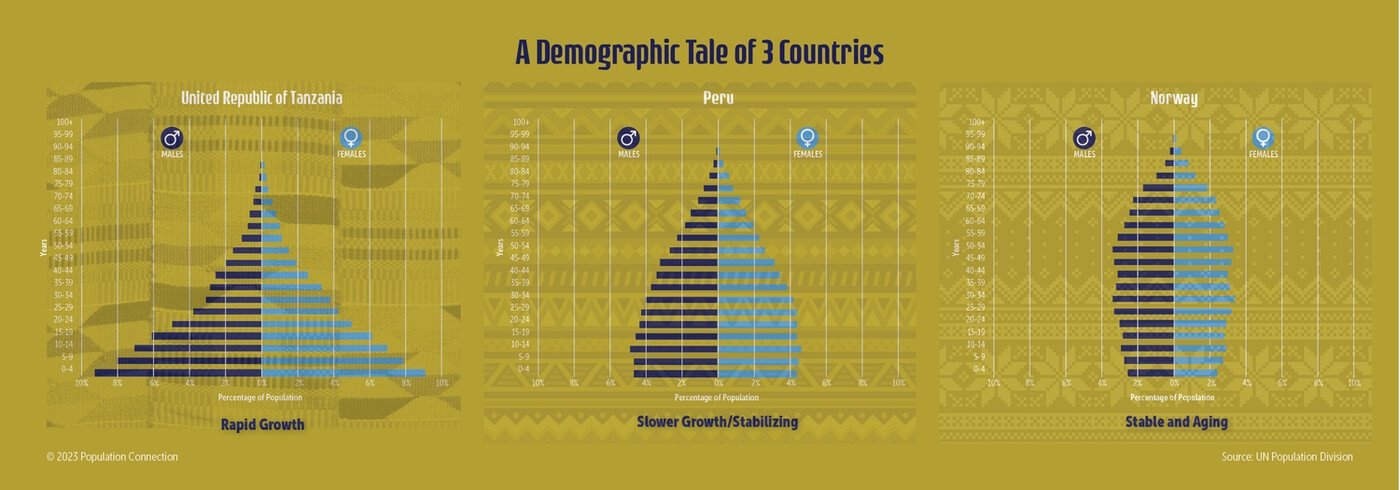
A Demographic Tale of 3 Countries: Population Pyramids of Different Countries
Population patterns vary across the globe with the most rapid growth in the least developed countries and little or no growth in the most developed countries. These patterns are largely determined by a country’s fertility and mortality rates, which are strongly affected by a region’s economic health. The more developed nations have the lowest birth rates and highest life expectancies, whereas the least developed countries have the highest birth rates and lowest life expectancies.
The fertility rate (the average number of children women bear) is the main driver of population growth. At the peak of global population growth in the early 1960s, the global fertility rate was five children per woman. Over the past 50 years, fertility rates have dropped dramatically across most of the world, due in part to improved global health, education, and income. In 2021, the global fertility rate was down to an average 2.3 children per woman. Within the average is a huge range, with a high of 6.8 children in Niger and a low of 0.8 in South Korea. The same is true of life expectancy, with a global average of 71, ranging from a high of 85 (Macao) to a low of 57 (Eswatini).
The “population pyramids” of the three countries in the infographic illustrate these differences in fertility and life expectancy.
Tanzania Population Pyramid
In Tanzania, the fertility rate is 4.7, about the average for sub-Saharan African countries (4.6 in 2021). Tanzania’s median age is 17 (very youthful), indicating a future of rapid population growth. According to the UN, the population in sub-Saharan Africa could triple to over 3.4 billion by 2100, becoming more densely populated than China.
Peru Population Pyramid
Peru’s pyramid exemplifies a country that has been rapidly developing and has seen lower fertility rates and higher life expectancy in recent years (2.2 and 72 respectively). Peru’s median age is now 28. In terms of economic prosperity, The UN classifies Peru as an Upper-Middle Income country (GNI per capita was $6,770 in 2022). This compares to $1,200 in Tanzania (Lower Middle Income) and $95,510 in Norway (High Income).
Norway Population Pyramid
Norway’s population age structure is typical of an industrialized country experiencing a rapidly aging population and below-replacement fertility rates. This trend would eventually lead to population decreases in parts of Europe and Asia in the coming decades. Much has been written in recent years about the challenges of a “graying” population, including an aging workforce and increased need for services for the elderly. Norway’s median age is 39 (more than twice as old as Tanzania) and has a life expectancy of 82.
SDG 1 (No Poverty) seeks to eradicate extreme poverty (1.1), “reduce at least by half the proportion of men, women and children of all ages living in poverty in all its dimensions” (1.2).
SDG 3 (Good Health and Well-Being) would increase child survival, boost life expectancy, and promote a healthy working-age population.

SDG 4 (Quality Education) that’s accessible to all young people and prepares them for employment can go a long way toward ending poverty.

SDG 5 (Gender Equality) also opens educational opportunities to all and gives people the means to make reproductive decisions.
SDG 8 (Decent Work and Economic Growth) has a great impact on family dynamics and national prosperity. This goal seeks to achieve “full and productive employment and decent work for all women and men, including for young people, and persons with disabilities, and equal pay for work of equal value” (8.5). This also includes promoting safe working environments (8.8).
Environment
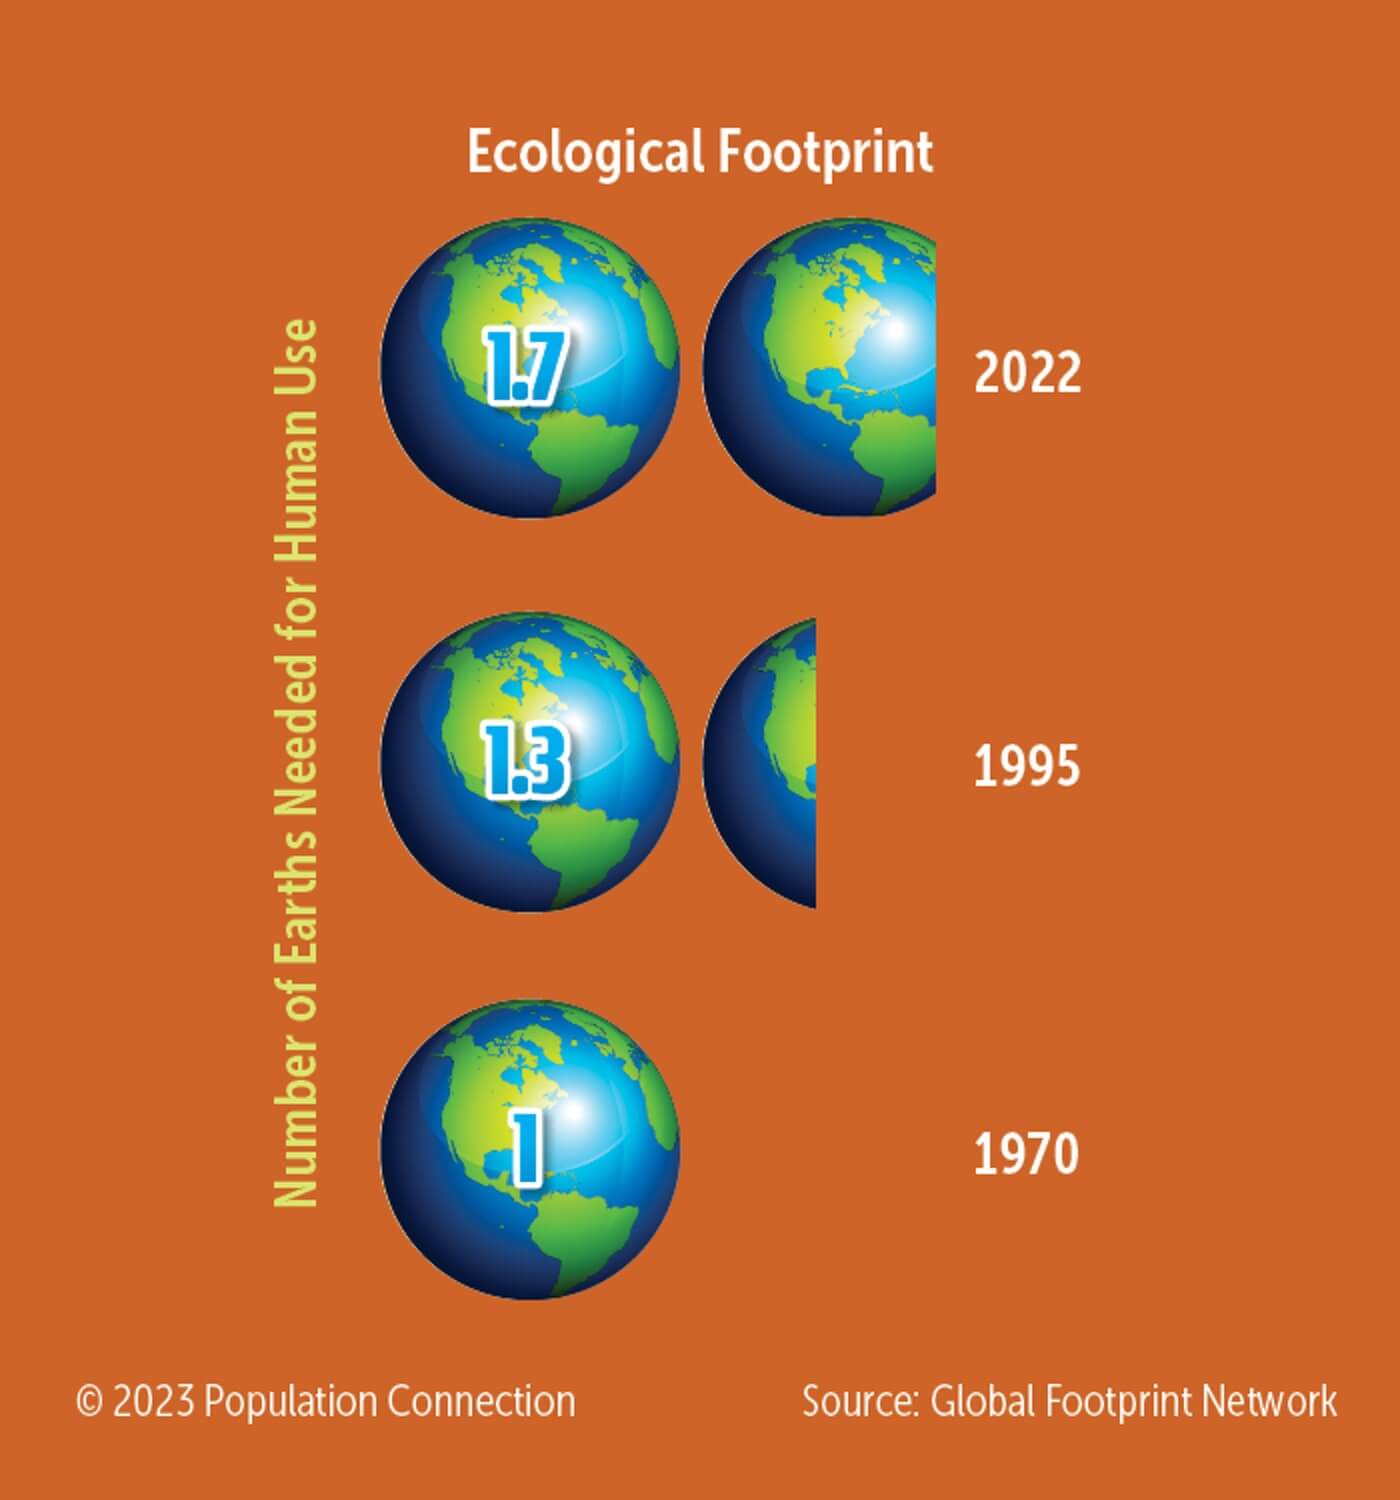
Ecological Footprint
What is an Ecological Footprint?
The ecological footprint was created as a tool to quantify all human demand on nature, and nature’s capacity to meet those demands. It measures how fast we consume resources and generate waste compared to how fast nature can absorb our waste and generate new resources. Biocapacity, or resource supply, is what nature provides and can absorb. It varies every year with ecosystem management, agricultural practices (such as fertilizer use and irrigation), ecosystem degradation, and weather. When demand (ecological footprint) is greater than the supply (biocapacity), the Earth finds itself in an ecological deficit, overshooting or exploiting an ecosystem faster than it can be renewed and leading to a build-up of waste and a depletion of natural resources.
Today's Ecological Footprint
Currently, humanity’s ecological footprint is 75 percent larger than what the planet can regenerate, and humans have been overshooting Earth’s available resources in this way every year since 1970. It now takes 1.75 years to regenerate what we use over the course of one year. Expressed another way; it would take 1.75 Earths to meet the demands of our ecological footprint.
On average, the richest countries consume 10 times as much of the average available resources as the poorest countries, and twice as much as the world average. The Global Footprint Network calculates that if all global citizens consumed at the rate of the average person in the U.S., we’d need five Earths worth of resources to meet the demand. Meanwhile, some of the world’s least developed countries have footprints too small to meet their basic needs. Why is there so much disparity in the size of average ecological footprints around the globe? Our individual use of resources varies depending on our lifestyles – our diets, modes of transportation, size and energy use of our homes, consumer choices, and waste disposal.
SDG 12 (Responsible Consumption and Production) strives to achieve the sustainable management and efficient use of natural resources. Monitored indicators include the reduction of our material footprint and of all waste generation (including food) and a shift to greater use of renewable energy.
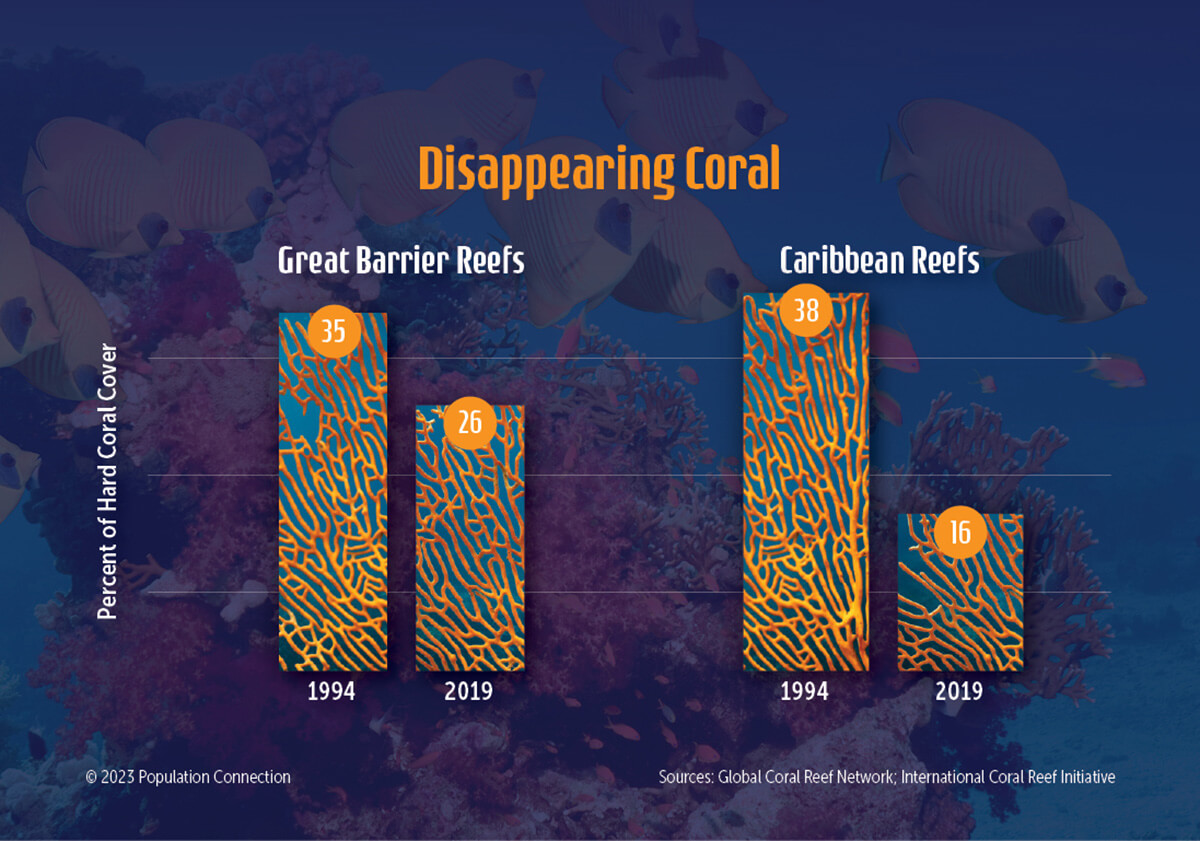
Disappearing Coral
With the rise of greenhouse gas emissions, our ocean, which serves as a carbon sink, has been warming. Nowhere are the effects of ocean warming greater than on coral reefs. Warmer water temperatures can result in coral bleaching. When water is too warm, corals will expel the algae living in their tissues, turning them completely white. This leaves the coral vulnerable to disease and can lead to large-scale die-off.
In 2005, half of the coral reefs in the Caribbean were lost in one year due to a massive bleaching event. In March 2016, an influx of warm water (about 1° Celsius warmer than usual) surrounded Australia’s Great Barrier Reef. Air and underwater surveys a month later showed severe bleaching in over 80 percent of the northern reef. By May, continued surveys suggested that as much as half of the corals on the northern section of the reef were already dead. Today, corals are in severe decline worldwide and could be entirely lost by 2050.
In addition to ocean warming, the reefs are threatened by damage from other human activities – coastal development, destructive fishing practices, mining, pollution, and tourism.
Why Do We Need Coral Reefs?
Coral reefs, along with other tropical marine habitats, support the highest marine biodiversity in the world – more than 1 million plant and animal species – though they cover less than one percent of the Earth’s surface. Reefs also provide a wealth of potential medicines for humans. Coral reef plants and animals are important sources of new medicines being developed to treat cancer, arthritis, human bacterial infections, Alzheimer’s, heart disease, viruses, and other diseases. If the present rate of coral damage continues unchecked, many of the potential and actual benefits of coral reefs may be lost.
SDG Goal 14 (Life Below Water) has specific targets for coral reef preservation including reducing marine pollution (14.1), limiting ocean acidification (14.3), and expanding the portion of marine and coastal areas that are protected by law (14.5).
Declining Biodiversity
Over the course of Earth’s history, species have come and gone – sometimes dying off gradually, sometimes catastrophically, as with the dinosaurs 65 million years ago. Scientists have recorded five past mass extinction events and believe that we are in the midst of a sixth mass extinction. The first five events pre-dated humans. The sixth and current event is being caused by humans – specifically the way we consume resources and convert habitat to other uses, like agriculture. The biggest threats to biodiversity can be remembered by using the mnemonic H.I.P.P.O (Habit Loss, Invasive Species, Pollution, Human Population, and Overharvesting).
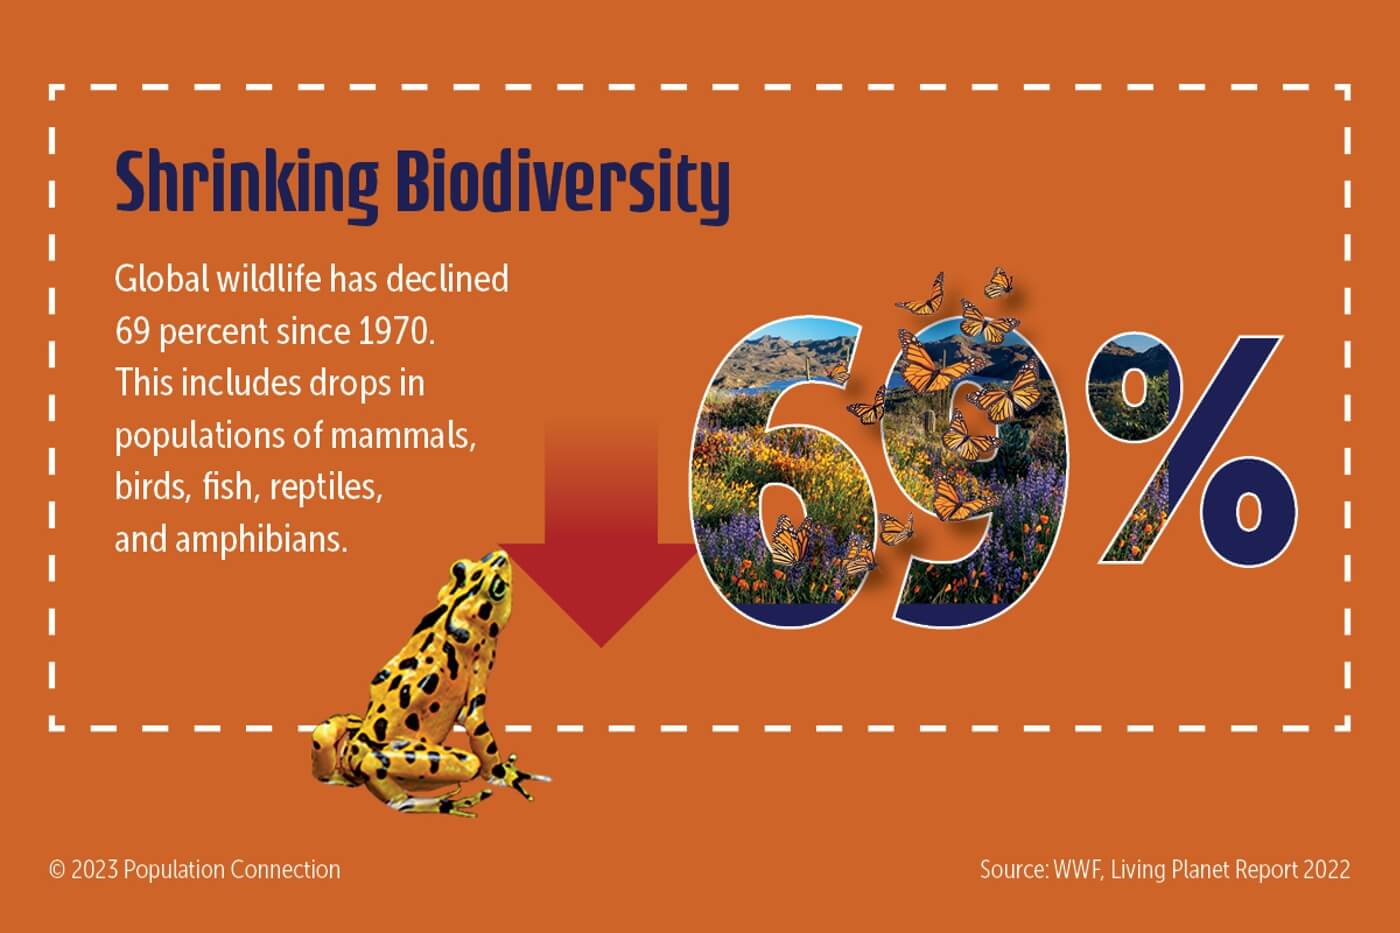
WWF’s latest Living Planet Index 2022, its most comprehensive assessment of wildlife populations, shows a 69 percent decline in the relative abundance of wildlife around the globe over the past 50 years. The IUCN Red List of Threatened Species is the world’s most comprehensive inventory of the global conservation status of plant and animal species. As of 2022, 42,100 species (28 percent of all those assessed) were listed as threatened with extinction, including 41 percent of amphibians, 34 percent of conifers, 36 percent of reef-building corals, 27 percent of mammals, 21 percent of reptiles, and 13 percent of birds.
Noted biologist E. O. Wilson writes in his book Half-Earth: Our Planet’s Fight for Life that “biodiversity, as a whole, forms a shield protecting each of the species that together compose it, ourselves included.” That’s because we depend on the Earth’s rich biodiversity for crucial ecosystem services – pollination, pest control, water filtration, soil creation, and climate regulation. Food, medicine, and shelter are all derived from the abundant organic resources of the Earth. Loss of biodiversity also deprives us of tools that might help in the struggle to feed ever-increasing numbers of people. For example, only a few of the more than quarter million known plant species have been investigated for their potential as crops. With every species that is driven to extinction, we lose some potential to cure disease, improve crop productivity, and enhance our standard of living.
SDG 15 (Life on Land) includes a number of targets aimed at protecting biodiversity, including conservation of habitats, ending poaching and wildlife trafficking, and controlling invasive species.

SDG 14 (Life Below Water) includes targets to protect marine ecosystems that also contain rich biodiversity.
Losing Forests
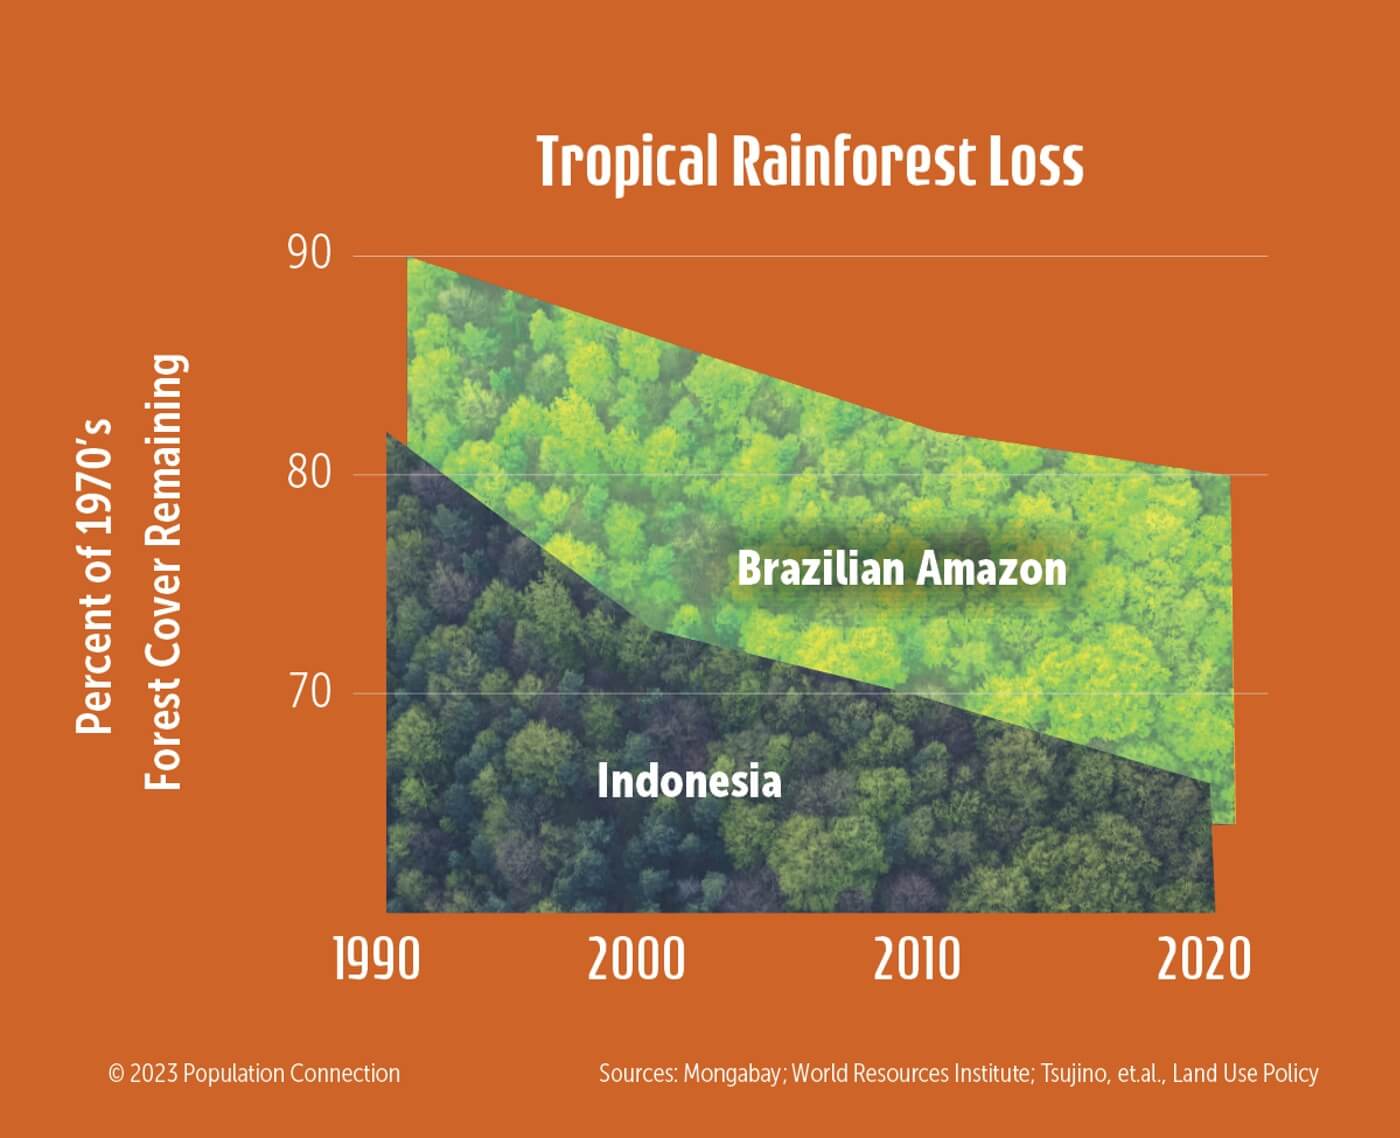
Most of the world’s forest lost over the past 30 years has been in tropical areas. Each year, some 70,000 km2 of rainforests are destroyed, an area equal to half the state of Florida. Of the 8 million square miles of tropical forests that once circled the globe, less than half remain.
The largest unbroken stretch of rainforest is found in the Amazon River basin of South America. Nearly two-thirds of this forest lie in Brazil, which holds about one-third of the world’s remaining tropical rainforests. Another 20 percent of the world’s rainforests are in Indonesia and Africa’s Congo Basin, while the rest are scattered around the tropical regions of the globe. Tropical forests are home to 50 million indigenous people, who rely on the forests for their livelihood and sustenance. Yet, these same forests are being cleared to provide products for export around the globe.
Causes of Deforestation in Tropical Rainforests
The number one cause of tropical deforestation is agricultural development - cattle ranching, soybean farming, and oil palm plantations, as well as subsistence agriculture. Timber cutting is another major contributor to tropical deforestation. Demand for furniture, paper, building materials, and other wood products continues to increase with population growth and rising global affluence.
Although tropical forests cover less than 7 percent of the global land surface, they house more than half the species of all living things. Rainforests are a treasure trove of foods, medicines and other resources we have only begun to discover. They also help regulate global climate. An intact forest naturally removes carbon dioxide from the air and stores it through the process of photosynthesis. When trees are burned or cut down and left to lie, much of the carbon returns to the atmosphere as carbon dioxide. Tropical deforestation releases 1.5 billion tons of carbon dioxide every year – that’s 15 percent of the total global CO2 emissions.

SDG 15 (Life on Land) calls for the conservation, restoration, and sustainable use of forests with targets for halting deforestation and increasing reforestation globally.
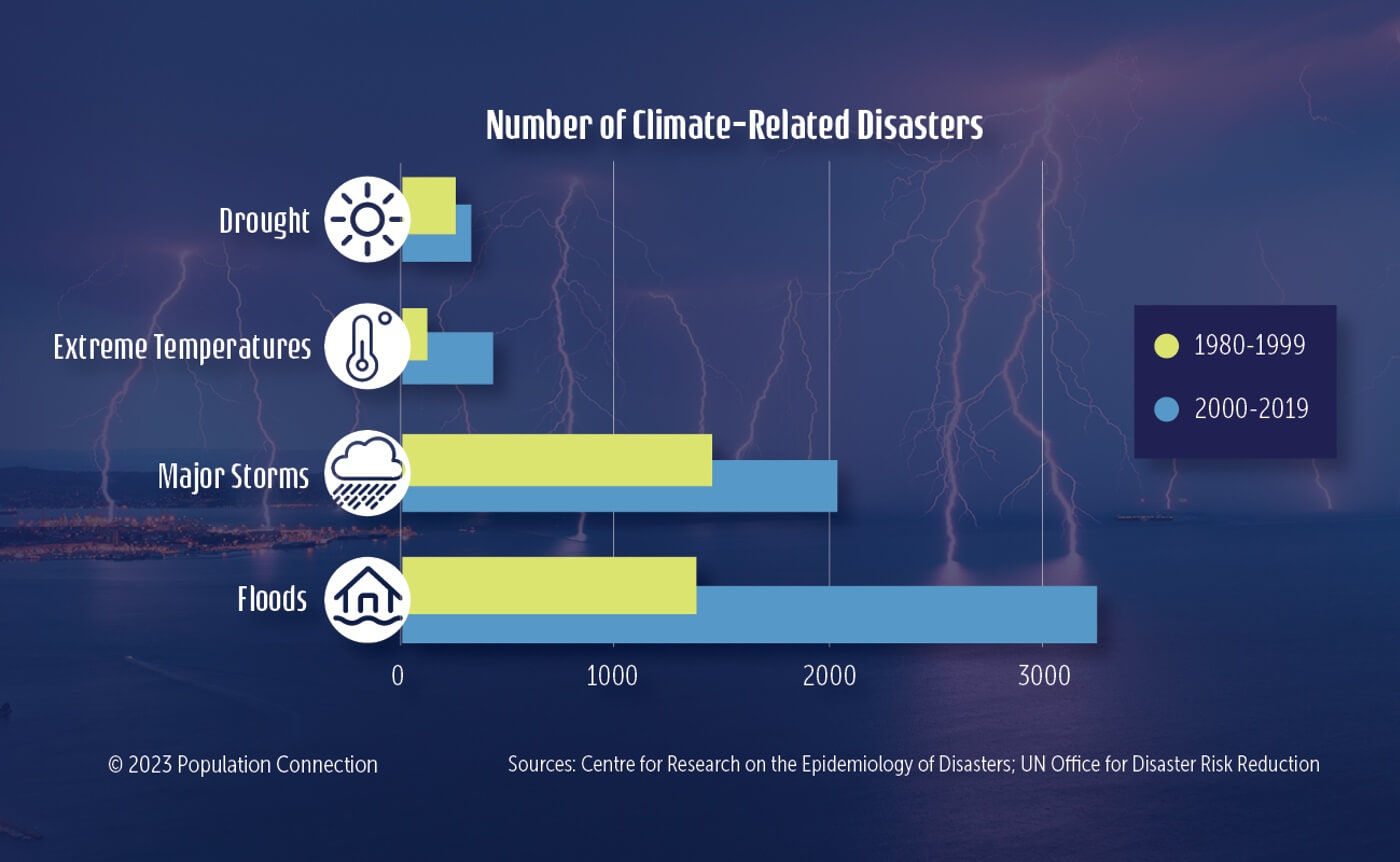
Climate Disasters
Climate-related disasters are on the rise, affecting communities around the globe. In addition to storm surges impacting coastal communities, inland communities can also be vulnerable to climate-related events including wildfires, landslides, and droughts. Earlier spring melt and reduced snowpack in mountain regions will affect the availability of water resources in the region. With some regions becoming inhospitable, people will be forced to move to other areas, growing the ranks of environmental migrants.
Extreme weather events are already taking a toll on human health. From 2000 to 2019, they have claimed over 1.2 million lives. In 2023, half of the world’s population experienced at least 30 days of extreme heat that was made at least three times more likely by climate change. Warming temperatures have also expanded the region for mosquitoes, which can carry viruses such as malaria, dengue fever, and Zika. Public health will also be affected by climate change’s threats to food security and clean water availability.
From the frequency of extreme weather to rising sea levels, the impacts of climate change often have disproportionate effects on historically marginalized or low-income communities, including Indigenous peoples, even though these communities typically contribute the least to greenhouse gas emissions. Subsistence farmers in less developed countries are at the mercy of changing agricultural outputs from more droughts and storm surges. In addition to more food insecurity, vulnerable populations will also see threats to their livelihoods, access to energy, water, and safe shelters. In short, lower- and middle-income countries – home to most of the world’s population – are less able to cope with climate-related disasters.

SDG 11 (Sustainable Cities and Communities) addresses the need for resilience against climate-related disasters. Target 11.5 seeks to “reduce the number of deaths and the number of people affected and substantially decrease the direct economic losses relative to global gross domestic product caused by disasters, including water-related disasters, with a focus on protecting the poor and people in vulnerable situations.” It also calls on cities and other settlements to adopt policies for climate adaptation and disaster risk reduction strategies (11.b).
Carbon Emissions and Climate Change
For tens of thousands of years, the levels of oxygen, nitrogen, and other gases in the Earth’s atmosphere remained essentially unchanged. This is often referred to as pre-industrial levels of greenhouse gases.
The Largest Contributor to Carbon Emissions
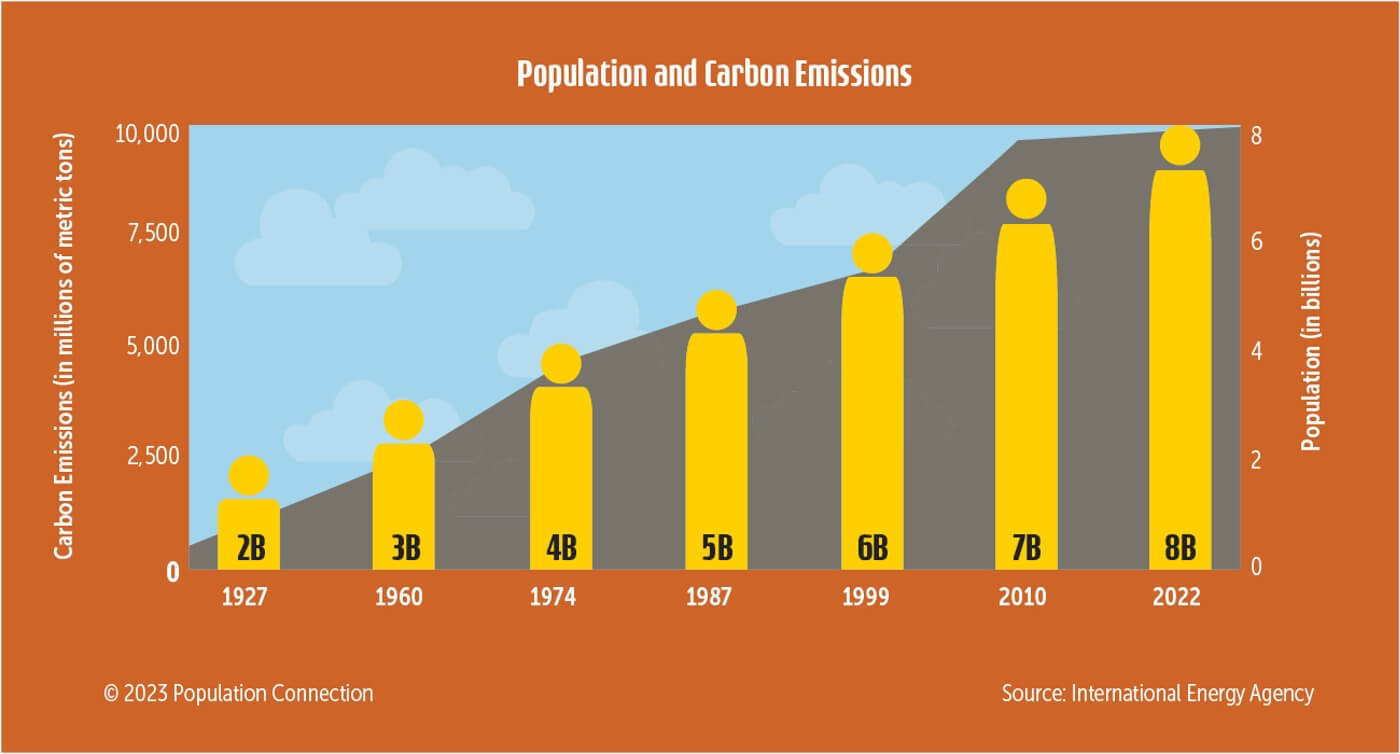
By the beginning of the 1800s, the world’s population had grown to 1 billion and the Industrial Revolution in North America and Europe was underway, fueled by coal emitting carbon into the atmosphere. A century later, the population had doubled to 2 billion and the age of petroleum was dawning. After World War II, energy use skyrocketed. Between 1946 and 1968, the use of motor fuel doubled, electricity consumption nearly tripled, and the production of petroleum-based plastics grew ten-fold. Increased agricultural production, to meet the needs of a growing population, also contributed a large share of greenhouse gases. Worldwide, CO2 emissions have more than doubled from 1970 (14.9 Gt CO2e) to 2021 (37.1 Gt CO2e) with emissions from the energy sector and industrial processes contributing the vast majority (88 percent) of the total increase. Agriculture, deforestation, and other land use changes have been the second-largest contributor.
Human activities have raised carbon dioxide levels in the atmosphere to a level significantly higher than it has been for hundreds of thousands of years. The link between population growth and increasing carbon dioxide emissions becomes especially clear when observing graphic data, as the growth curves for both follow a similar path over the past few hundred years.
SDG 13 (Climate Action) aims to integrate climate change measures into national policies, strategies, and planning. This includes “improving education, awareness-raising and human and institutional capacity on climate change mitigation, adaptation, impact reduction and early warning.” While none of the SDGs address population directly, target 3.7 (ensuring universal access to sexual and reproductive health-care services, including for family planning, information and education) would enable people to choose their desired family size.
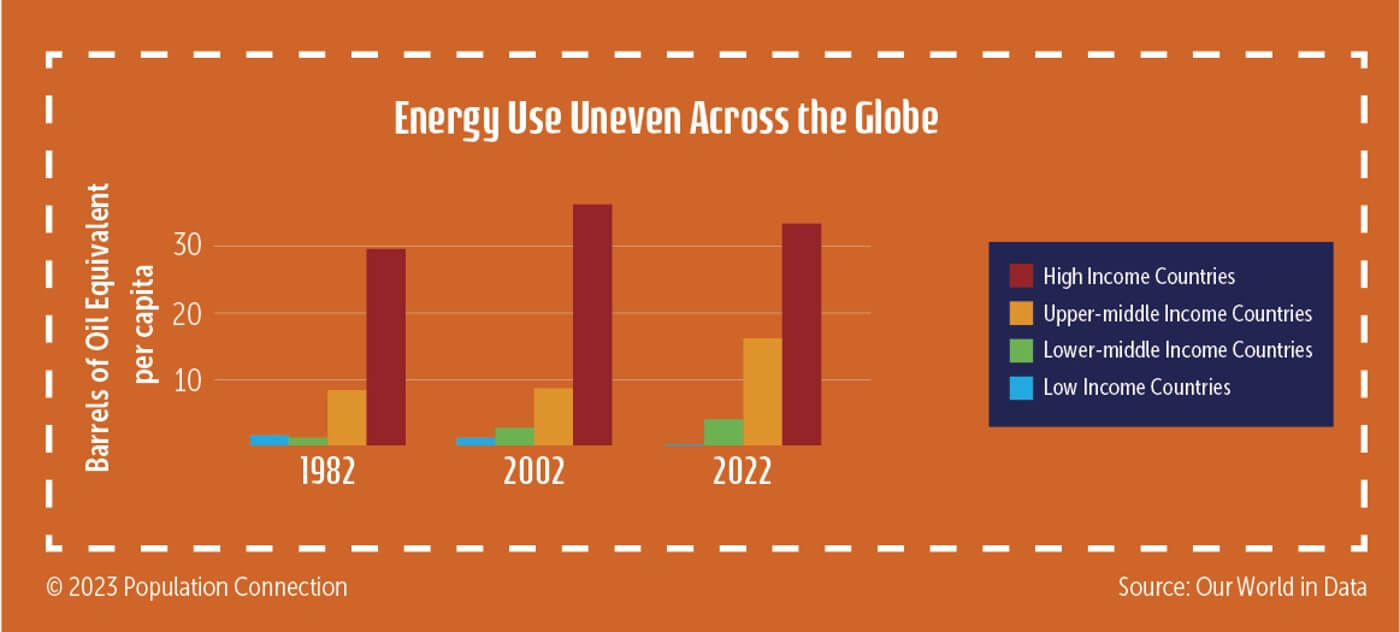
Energy Inequality
Our global society needs to balance our future energy needs with our needs to protect ecosystems and human health. At the same time, we need to ensure that all of the world’s people have access to the energy necessary to enable households and businesses to thrive. Today, per capita energy use varies widely around the world.
Although the percentage of the global population living with access to electricity continues to increase, 760 million people (80 percent of whom live in sub-Saharan Africa) still lacked access to modern energy sources as of 2021. Lack of electricity stymies progress in many ways from the student trying to use the internet to the small business running machinery and lights. It also poses threats to human health. Nearly one-third of the world population (2.3 billion) relies on biomass as a cooking fuel. Indoor air pollution from cooking with solid biofuel is linked to 3.7 million premature deaths each year.
SDG 7 (Affordable and Clean Energy) includes ensuring “access to affordable, reliable, sustainable and modern energy for all.” Meeting this goal would require international investment in infrastructure in the poorest and least accessible parts of the world. This infrastructure would need to make use of cleaner energy sources to help meet global goals for caps on carbon emissions even as demand for energy grows.
Renewable Energy on the Rise
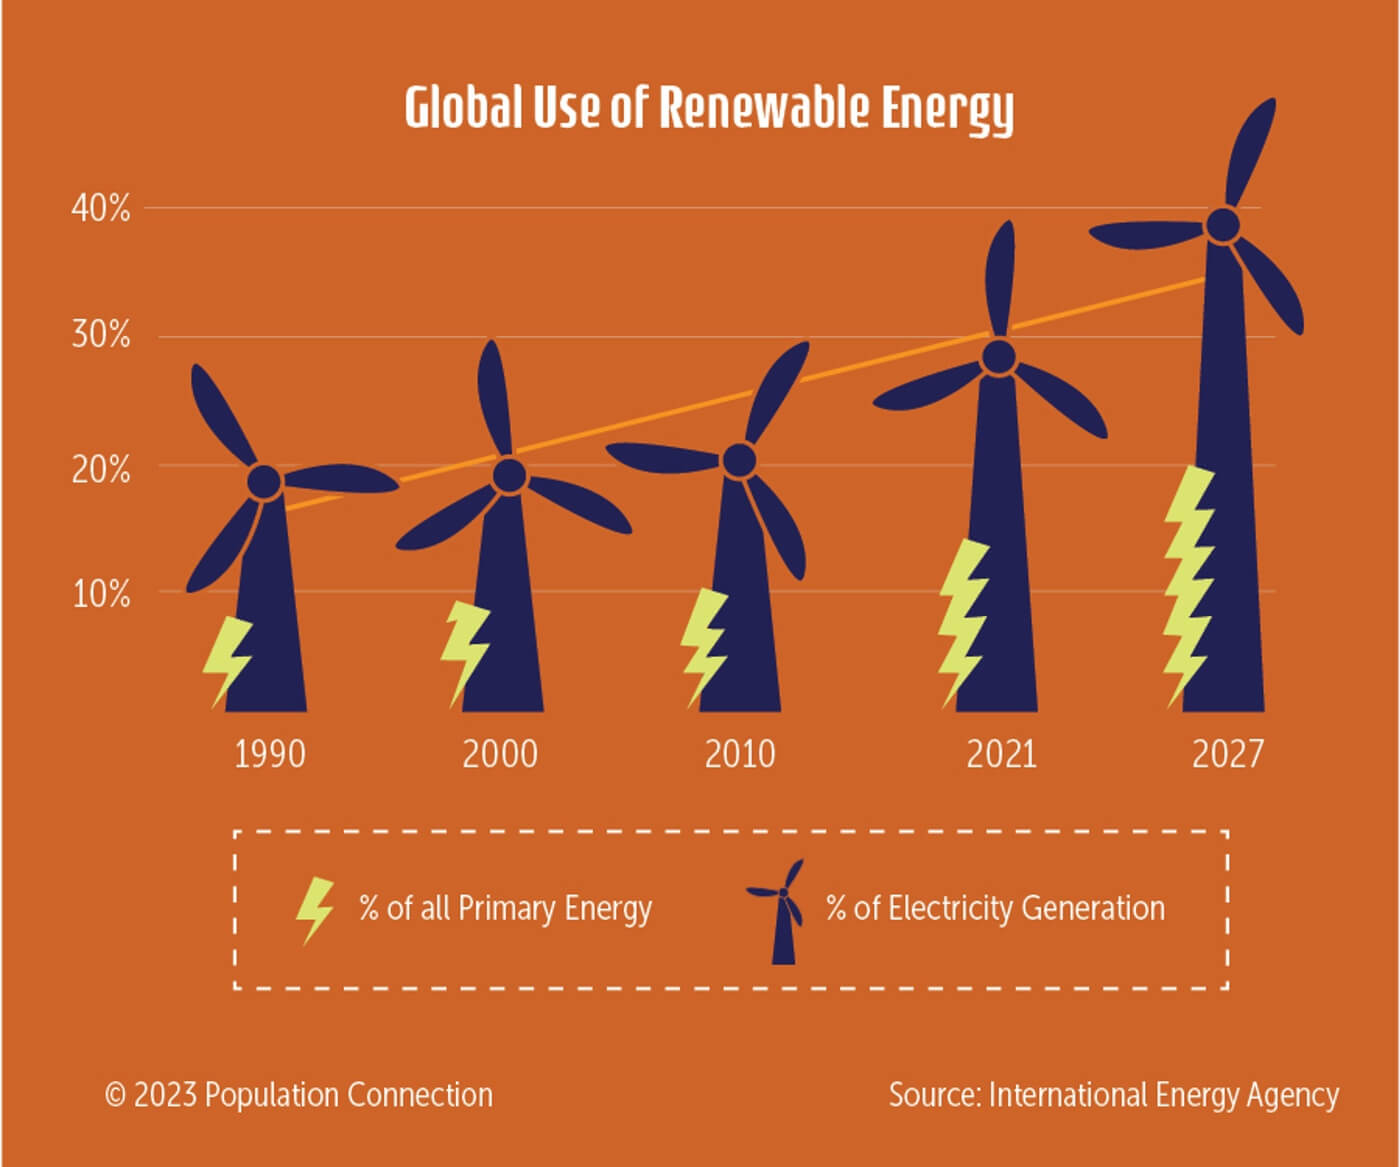
The fastest growing source of electricity generation worldwide is renewable energy – solar, wind, hydroelectric, biomass, and geothermal. In 2021, renewable sources provided 13 percent of the world’s energy and 28 percent of electricity generation. As world leaders have assessed the threats to our climate of adding more greenhouse gases to the atmosphere, they have looked to the growth of renewable energy as a cleaner, more sustainable road forward.
The highest growth in renewables in recent years has been with solar photovoltaic (PV) energy and wind energy. Solar energy, which converts sunlight into electricity, is likely to be the cornerstone of a future sustainable energy system. Sunshine is available in great quantity and is more widely distributed than any other source. In the not-too-distant future, societies may use the sun to heat most of their water, and new buildings may take advantage of natural heating and cooling to cut energy use by more than 90 percent. Wind power, which uses propeller-driven mechanical turbines perched on strategically located towers, also has great potential to provide electricity in most countries. As of 2019, wind turbines produced 20 percent of the world’s renewable energy.
Benefits of Renewable Energy
Renewable energy sources hold a lot of promise for providing cleaner energy as nations work to contain greenhouse gas emissions. In 2022, renewable energy accounted for over 90 percent of all new power installations around the globe. Renewable energy installations are expected to increase dramatically within the coming years and will likely surpass coal as the largest source of electricity generation by 2025. Already, the cost of using renewable energy is becoming competitive with traditional fossil fuels and market forces are likely to make renewable sources more widespread in the decades to come, especially in more developed countries.

SDG 7 (Affordable and Clean Energy) calls for a substantial increase in the share of renewable energy in the global energy mix by 2030 (7.4). This includes promoting investment in clean energy technology and infrastructure throughout the world.
Food & Agriculture
Global Food Insecurity
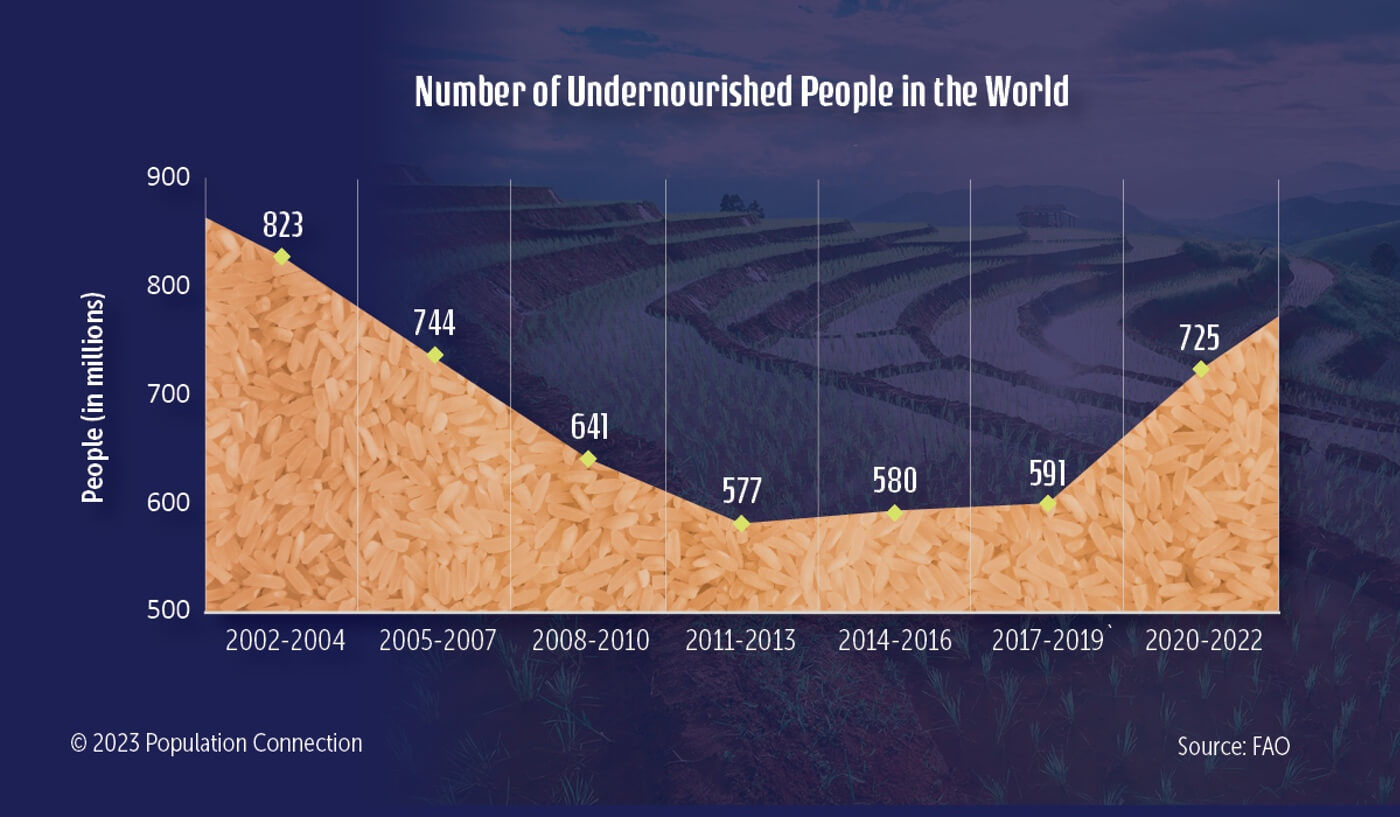
In 2023, the UN Food and Agriculture Organization (FAO) reported that 700-800 million people were chronically hungry and about 30 percent of the global population was moderately or severely food insecure.
What Causes Global Food Insecurity?
The reasons for food insecurity are varied and most often tied to poverty. While there is sufficient food grown globally to feed the current world population, it is not distributed evenly. Access to sufficient, nutritious food is a problem for people who live in areas with civil conflicts, unstable economies, or where changing weather patterns have impaired crop production. In some parts of the world, food insecurity has reached crisis levels, as in Ethiopia, Madagascar, South Sudan and Yemen, now at risk of famine. Food insecurity is also a fact of life for the millions of the world’s refugees, displaced from their homelands.
The FAO estimates that healthy diets are unaffordable for 3 billion people around the world, including those living in low-income and low-access areas in some of the world’s wealthiest countries. In Northern America (U.S. and Canada), nearly 30 million people are considered to be food insecure, many of whom reside in food deserts, locations with limited access to grocery stores. The COVID-19 pandemic exacerbated food insecurity in nearly every country due to lost income and disruptions in food supply chains.
SDG Goal 2 (Zero Hunger) seeks by 2030 to “End hunger, achieve food security and improved nutrition and promote sustainable agriculture.” In addition to supporting sustainable agricultural practices, the UN hopes to meet that goal by supporting small-scale farmers and allowing equal access to agricultural lands, new technologies and markets. This would also require an investment in the infrastructure that enables reliable agricultural production, such as sustainable soil and water management.
Global Implications of a Meat-Based Diet
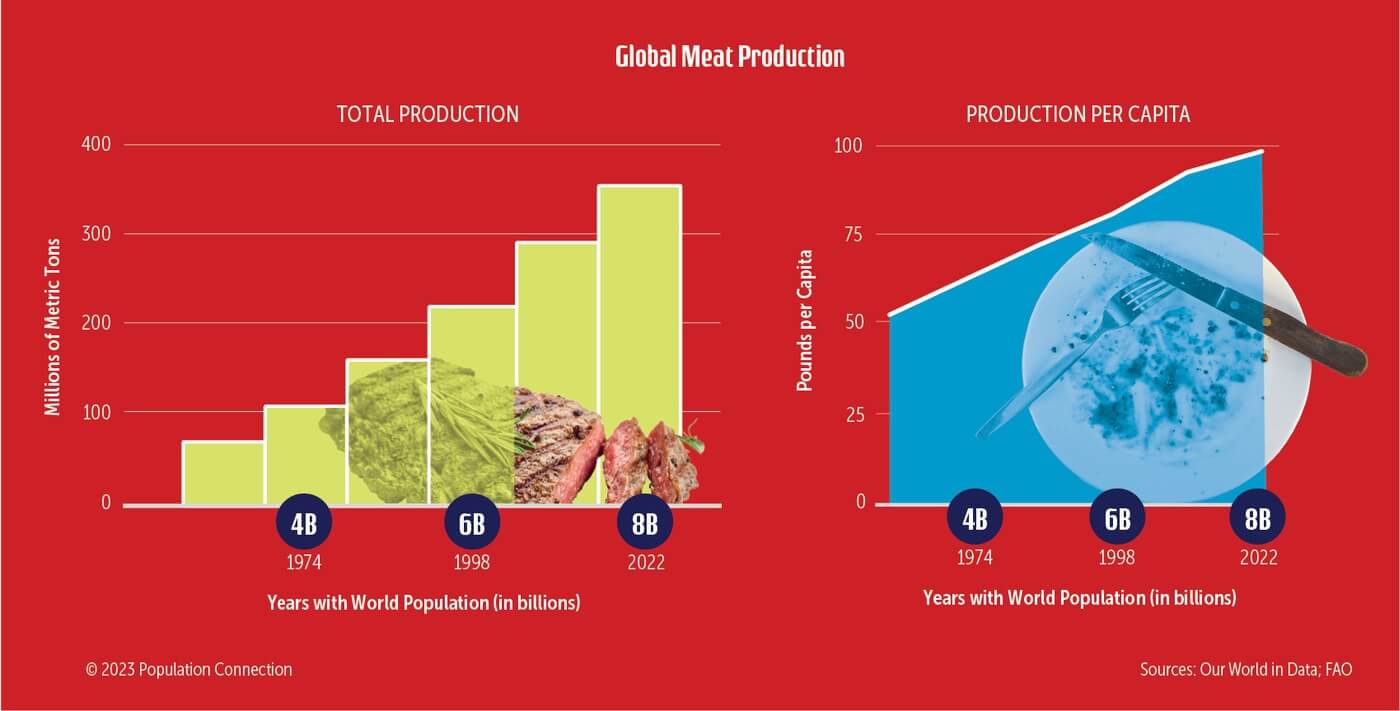
Much of the agricultural expansion we’ve seen in recent decades has been in response to changing diets around the world, rather than in an effort to promote food security. With the increased wealth of consumers in rapidly developing economies has come a greater demand for meat and dairy products. As a result, more land is being converted for grazing livestock and for growing animal feed. In fact, over one-third of the global grain production is fed to animals. Only a fraction of the calories in that animal feed actually winds up on people’s dining tables. Because of this inefficient feed-to-food conversion, more people could be fed eating lower on the food chain (more fruits, vegetables and grains) and with smaller portions of animal proteins. “The world’s farmers currently produce enough calories to feed 9 billion people a healthy, mostly vegetarian diet,” writes environmental journalist Joel Bourne. Unfortunately, these calories are not produced, stored, and distributed in a way to make them accessible to our current 8 billion people.
Why is Eating Meat Bad for the Environment?
Environmental impacts of raising livestock go beyond the land they take up. Livestock, especially cattle, use a tremendous amount of water and are responsible for about 12 percent of global greenhouse gas emissions. Making informed choices about the type and quantity of meat we eat, and understanding the environmental risks of different agricultural processes and technologies, are critical to a sustainable future.

SDG 2 (Zero Hunger) includes a target for sustainable food production systems that “increase productivity and production, that help maintain ecosystems, that strengthen capacity for adaptation to climate change, extreme weather, drought, flooding and other disasters and that progressively improve land and soil quality.”
Global Water Crisis
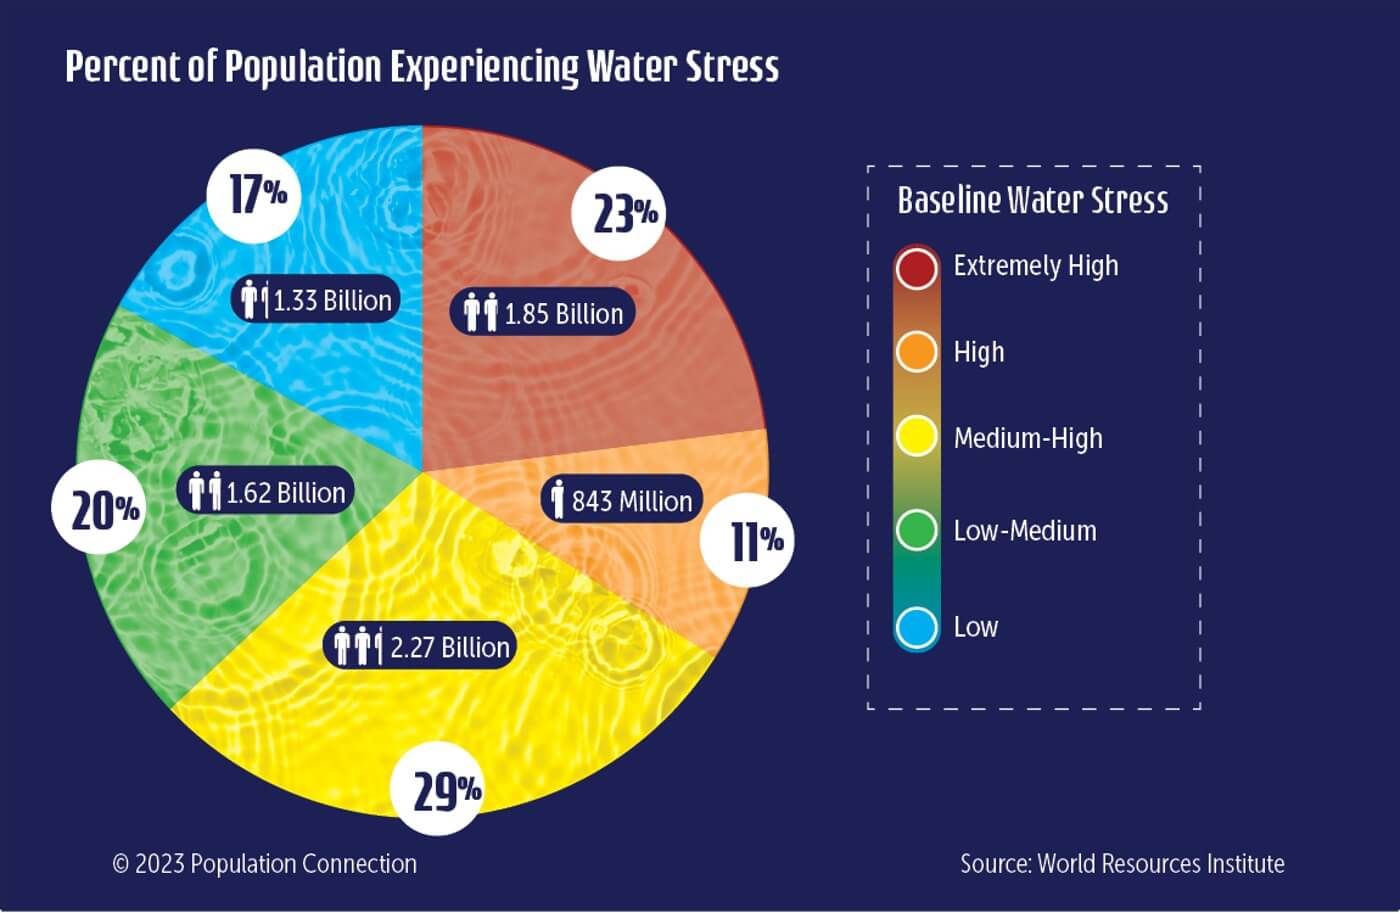
As the world’s population grows, so does the demand for water. Over the past century, the world’s population has quadrupled and use of water has grown by a factor of six. According to the United Nations, 2.4 billion people lived in water-stressed countries in 2022.
Why has water use been growing faster than population growth? Agriculture accounts for 70 percent of freshwater withdrawals. Economic growth in many parts of the world has contributed to shifting diets away from predominantly starch-based foods to more meat and dairy, which require more water.
At the same time that demand for water is increasing, our supplies are diminishing. Most of the freshwater in the world (about 69 percent) is locked away in glaciers and icecaps. The rest is found in surface water (streams, lakes, rivers, and wetlands) and in underground aquifers. Aquifers – underground layers of rock saturated with water that can be brought to the surface through natural springs or by pumping – supply over one-third of the water used by humans worldwide. They can take thousands of years to fill up and only slowly replenish with water from snowmelt and rain. NASA satellites show that more than half of the Earth’s 37 largest aquifers are being depleted with more water being withdrawn than replaced over the past decade. Surface water, too, is being depleted. Aside from irrigation, water is used for manufacturing and food processing, generating electricity, and household use.
Climate Change and Water Crisis
Water supply is also being impacted by global climate change. In many regions of the globe, including the American West, the climate is becoming hotter and drier, leading to decreased rain and snow, with resulting drought. Western U.S. states have been in the midst of a drought for much of the 21st century, with climate change affecting the length and severity of dry conditions. From South Africa to Brazil to North Korea, extreme drought has been affecting agriculture, the economy, and households as water shortages become a fact of life.
How to Solve the Global Water Crisis
The most obvious step to combat water scarcity is to improve the efficiency with which water is used and to recycle used water. Currently, about half of used water worldwide is collected or treated. Water is essential for economic and social development, public health and agriculture, and there is no substitute. Meeting the future needs of the world’s people will require a combination of water conservation, pollution treatment, and new technologies. It may also require the global community to rethink our diets, enforce environmental protections, and stabilize population size to be able to sustainably manage this finite resource.
SDG 6 (Clean Water and Sanitation) aims to “substantially increase water-use efficiency across all sectors and ensure sustainable withdrawals and supply of freshwater to address water scarcity and substantially reduce the number of people suffering from water scarcity” (6.4), and to “implement integrated water resources management at all levels” (6.5).
Health & Wellness
Water is Life
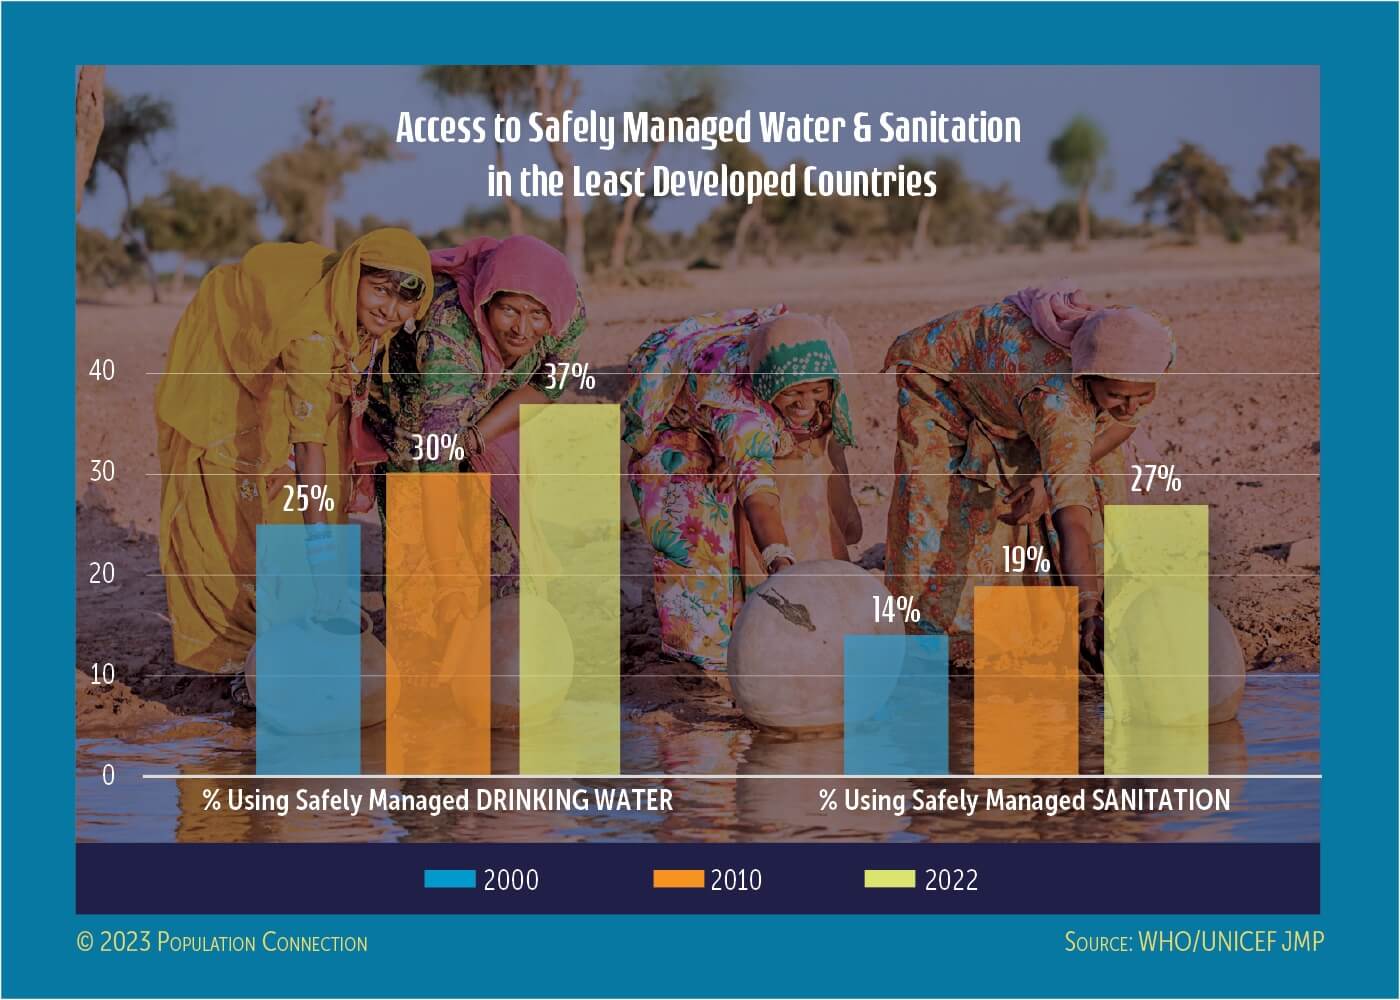
From 2000 to 2022, 2 billion more people gained access to safely-managed drinking water (from 3.8 to 5.8 billion). That still leaves about 2.2 billion people (1 in 4 people) lacking this vital service. Strides have been made in expanding access to safely-managed sanitation services (toilets and latrines) as well. Even so, nearly half the world population still live without these improvements, with over 400 million people still practicing open defecation.
Deaths Dues to Contaminated Water
Contaminated water and poor sanitation are linked to a number of diseases including cholera, diarrhea, dysentery, hepatitis A, typhoid, polio, and intestinal worms. One million people die each year from diarrhea, one of the top killers of children under age five in low-income countries. Most cases of diarrhea result from contaminated water or food. These are deaths that could be prevented with investments in improved infrastructure, sanitation facilities, and hygiene promotion.

SDG 6 (Clean Water and Sanitation) aims to “Ensure availability and sustainable management of water and sanitation for all” by 2030. As of 2023, most countries are not on track to meet this goal, which would take a greatly accelerated rate of progress and financial investment. Yet the investment bears dividends. For every $1 invested in water and sanitation improvements, over $4 is returned in increased productivity, primarily based on improved health and more time to work. Today, over two-thirds of people in sub-Saharan African countries have to leave their homes to collect water for cooking, drinking and bathing, often walking long distances with heavy buckets. Most of this backbreaking work falls to women and children. Reaching a target to provide clean water to all the world’s people would also need to include ready accessibility.
Striving for Maternal and Child Health
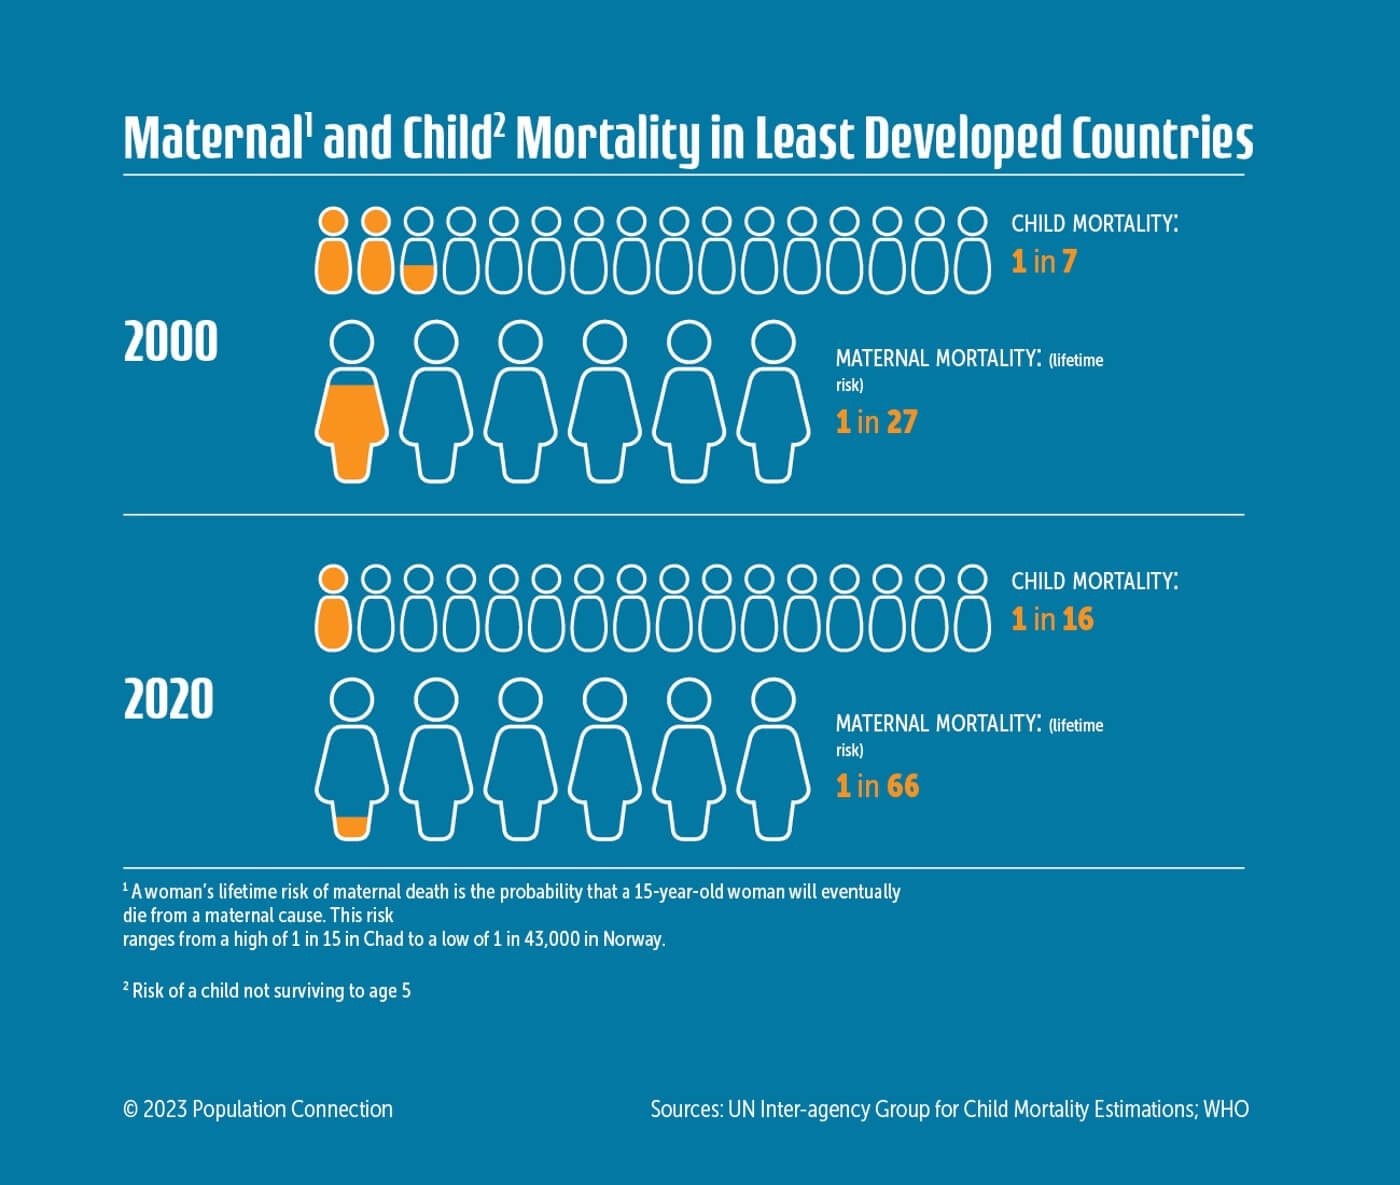
Substantial improvements in child survival have been made in the last 30 years, especially with widespread vaccinations against common childhood diseases like measles, mumps, and whooping cough. These immunizations prevent 2-3 million deaths each year and have been one of the greatest areas of progress for global childhood health. Today’s mortality rate among young children is less than half of what it was in 1990.
Healthy babies require healthy mothers. Pregnancy and childbirth bring health challenges the world over, but the risks are especially high in under-resourced areas, with inadequate numbers of medical professionals and health care facilities to meet the needs of the population. Nearly 800 women die each day from preventable causes related to pregnancy and childbirth, and most of those deaths occur in the least developed countries. Though maternal mortality rates have dropped significantly in recent years, too many girls and women still lack access to skilled medical care during pregnancy, as well as during and after childbirth.
To avoid maternal deaths, it’s also important to prevent unwanted pregnancies and pregnancies among younger teens through contraception and sexuality education. Reproductive health care is an important part of overall wellness for the global population. An estimated 257 million women worldwide have an unmet need for contraception.

SDG 3 (Good Health and Well-being) seeks to “Ensure universal access to sexual and reproductive health care services, including for family planning, information and education, and the integration of reproductive health into national strategies and programs.” (3.7)

SDG 5 (Gender Equality) includes ensuring “universal access to sexual and reproductive health and reproductive rights.” (5.6)