Projecting Global Population to 2050 and Beyond
Numbers help tell stories. But numbers can also be the story. The world’s population exists in numbers – billions of numbers. In 2022, the UN marked human population reaching 8 billion and that was the story, not just for the size of the number but for the short amount of time it took to reach. Just a hundred years prior, the world’s population had yet to reach 2 billion, less than one-fourth of the number on Earth today. As we continue to add tens of millions of people to the world population each year, where are we headed? And when, if ever, will the world population stop growing?
Calculating Human Population Growth
Just like a historian assists in making sense of the past through the interpretation of records and events, a demographer acts in a similar capacity to make sense of human populations, both their present trends and future projections. And like historians, demographers use the best information available, beginning with a census. Most countries conduct a census – a count of the populace – every decade. In addition to census data, demographers consider fertility and life expectancy when making projections.
Fertility rate, the primary variable in making population projections, is defined as the number of children a woman will bear during her primary reproductive years (age 15-49). For a country to maintain the size of its current population, it must reach a fertility rate of 2.1; this is called replacement level fertility. With a fertility rate of 2.1, a population is considered stable, which is a way of saying that the next generation of children born will equally replace the generation of adults who have passed.
With the current global fertility rate at 2.25, our population increases. While the difference between a fertility rate of 2.1 and 2.25 may seem small, this difference propels population growth by tens of millions of people annually.
Most demographers expect global population growth to continue until the 2080s before it levels off. On the World Population History timeline, this growth is observed through the year 2050 when the global population is projected to be 9.7 billion. the United Nations publishes population projections in their report World Population Prospects.
As demographers gain more accurate data from country reports, the projections are adjusted. For example, the UN’s World Population Prospects: 2017 Revision reported the median projection for global population at an estimated 11.2 billion in 2100. The 2019 Revision decreased that median projection to 10.9 billion. Now, the 2024 Revision reduced the median estimate further to 10.3 billion following the analysis of recent health and demographic surveys.
Because so many factors are at play in determining fertility rates, there are a range of potential outcomes for our future global population. The United Nations accounts for this by developing a series of possible population outcomes rather than one exact number. The report provides three projections, based on the likelihood of three different scenarios unfolding. Within each of the population projections there is an expected decline in fertility rates, but to what extent is still up for debate, as is the anticipated peak of our total global population.
Future Population of the World – UN Projections
The graph below is from the UN’s report, World Population Prospects: 2024 Revision.
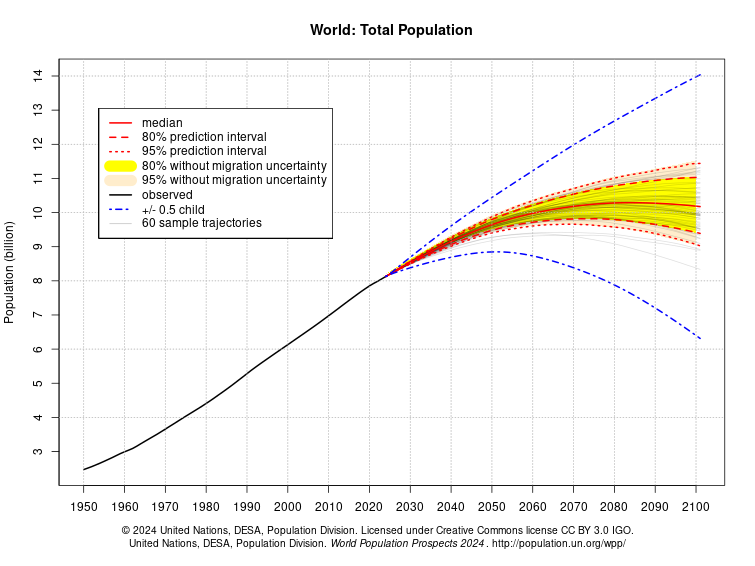
Median Variant
Under the assumption that the current global fertility rate of 2.25 will continue to decline and reach replacement level (2.1) by 2050, the United Nations projects the world’s population at 9.7 billion by then. Though the fertility rate will decrease, total population itself is not expected to decline until the end of the century because of a phenomenon known as “demographic momentum.” The median, or medium, variant outcome (the solid red line on the graph above) has the highest statistical probability based on current census data and our understanding of fertility rate’s historical record. The median projection of global population in 2100 is 10.2 billion.
80% Prediction Interval Projection
The dashed red line on the graph shows the 80% prediction interval: demographers believe there is an 80% chance our future population will fall between these two lines. The low end of this interval is 9.4 billion people in 2100 and the high end is 11 billion in 2100.
95% Prediction Interval Projection
As you move further from the median, the likelihood of the numbers being accurate becomes higher. But at the same time, the range is significantly larger. On the graph, the dotted red line is the 95% prediction interval. If the global fertility rate does not fall as quickly as expected, there is the possibility of our population reaching 11.4 billion by 2100. Alternatively, a much more rapidly declining fertility rate would produce a global population of 9 billion by 2100. So, demographers are 95% certain that the world should prepare for a population somewhere between 9 billion and 11.4 billion by the end of the century. That is a high level of certainty, but with a range of almost 2.5 billion.
Population Estimates
The United Nations population projections is just one set of estimates as to future population growth, but it is the most widely used worldwide. This graph tracks fertility rate as a number but doesn’t necessarily explain why or how fertility rates change. Nor does it tell us where population growth is happening geographically. For that information, we need more help from demographers.
What Causes Changes in Fertility?
To project how fertility rates might change in future years, we need to understand what could cause those changes. A number of factors can affect how many children people choose to have, including economics, cultural norms and traditions, education, public and reproductive health care. Demographers analyze trends in these areas to determine how they might affect fertility. For example, with improved healthcare, infant mortality rates decline, and as a result of more children living on to their adolescent years, families are less likely to have additional children. Another factor influencing fertility rate is girls’ education. The higher the percentage of women within a country who have obtained at least a high school level of education, the lower the fertility rate. Because these and other factors (e.g. income, gender equity, traditions/cultures, health education, contraceptive use, personal and national security) have been linked to fertility trends, demographers track this information within countries to project what the future may hold.
Africa’s Growing Challenge
Up to this point the fertility rate has been discussed as a global average, but to really grasp population projections we need to explore that rate by country and region. One of the regions providing the greatest challenge to population projections is Africa.
Since the 1950s, fertility rates have dropped dramatically across most of the world, due in part to improved global health, education and income. Because fertility rates decreased so quickly in developing countries in Latin America and Asia, population projections were made based on a continuation of those trends holding true worldwide. But in many countries within Africa this rapid fertility rate decline has not happened. According to the UN, the population in sub-Saharan Africa could triple by 2100, nearing 3.8 billion people and becoming more densely populated than China.
So why have fertility rates remained so high? Of the 44 countries worldwide classified as “least-developed,” 32 of them are located in Africa. Lower levels of income, adult literacy (specifically the large gender gap in education), and lack of essential healthcare all have contributed to the current high fertility rates. The reason to highlight Africa in particular is because half of the world’s expected population growth will occur on the continent; any economic and social improvements leading to lower fertility rates in this region may have a dramatic impact on our larger global population projection as a whole.
Population is expected to grow from 6.7 billion to 8.4 billion in less developed countries by 2050, yet remain largely unchanged in more developed countries.
Other Considerations: Life Expectancy
Although the fertility rate is a main determinant of future population size, it is by no means the only variable. Another key determinant is life expectancy. The UN forecasts increases in longevity through the century’s end, with global life expectancy rising from 73 today to 82 in 2100. The greatest gains are expected in Africa, Asia and Latin America, as child mortality rates continue to fall.
Over the past 50 years, international efforts and funds have helped to reduce fertility rates through commitments to family planning services and child survival.
An Unfinished Story
Only time will tell which projection our global population will match. But one this is certain – 8 billion is a large number of people who have basic needs and require resources, particularly if current consumption rates remain constant, or increase. Human population growth’s story isn’t a finished work. The decisions we make today as individuals and societies can affect the size of tomorrow’s global family.